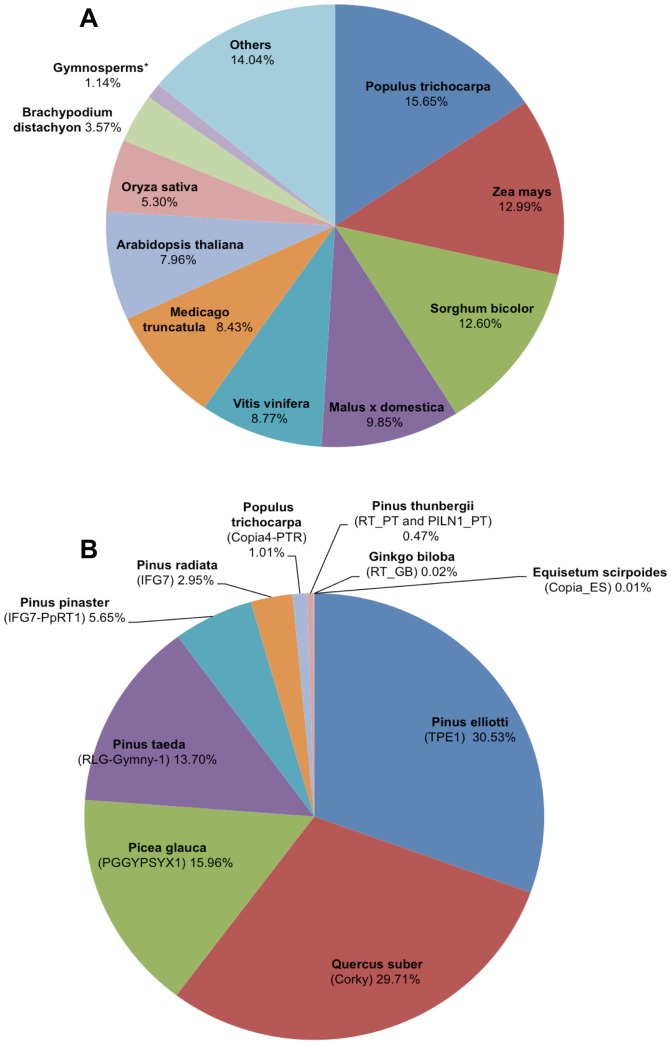
Figure 3. Distribution of homology-based repeat annotations by species.
Interspersed repeats were analyzed via a redundant similarity search (CENSOR against CPRD). Percentage in each sector represents base pair coverage over the redundant annotations. (A) Displays species coverage for full-length and partial elements. Species with contributions less than 3%, were categorized as ‘Other’. (B) Displays species coverage for full-length elements only.

