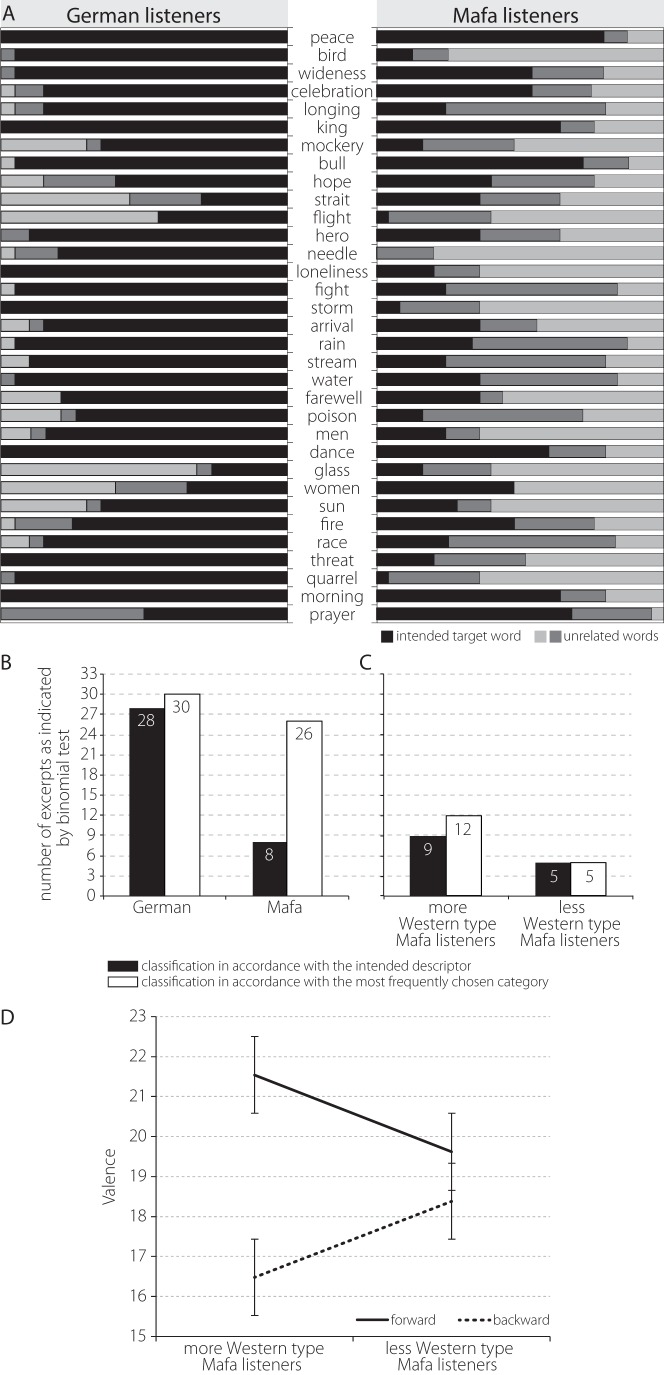
Figure 1. Association profiles.
Figure 1A shows the mean association profiles of German and Mafa listeners for the Western musical pieces presented. The middle row indicates what the musical pieces were intended to express, the bars in each line correspond to the three words in each trial that the participants could choose (black – intended descriptor, light and dark grey – unrelated words). Figures 1B and 1C show the absolute number of words (out of a total of 33) classified in accordance with the intended descriptor (in black), as indicated by a binomial test. It furthermore shows the number of words that were chosen in accordance with the most frequently chosen category(as indicated by a binomial test) and thus the extent to which there was agreement within the group in the choice of words. Figure 1B shows these data for all Germans and Mafa, Figure 1C for the more Western type listeners and the less Western type listeners that performed both experiments (N = 12). Figure 1D shows the interaction effect observed in the ANOVA, depicting the mean valence ratings for forward and backward music excerpts, error bars showing standard errors.

