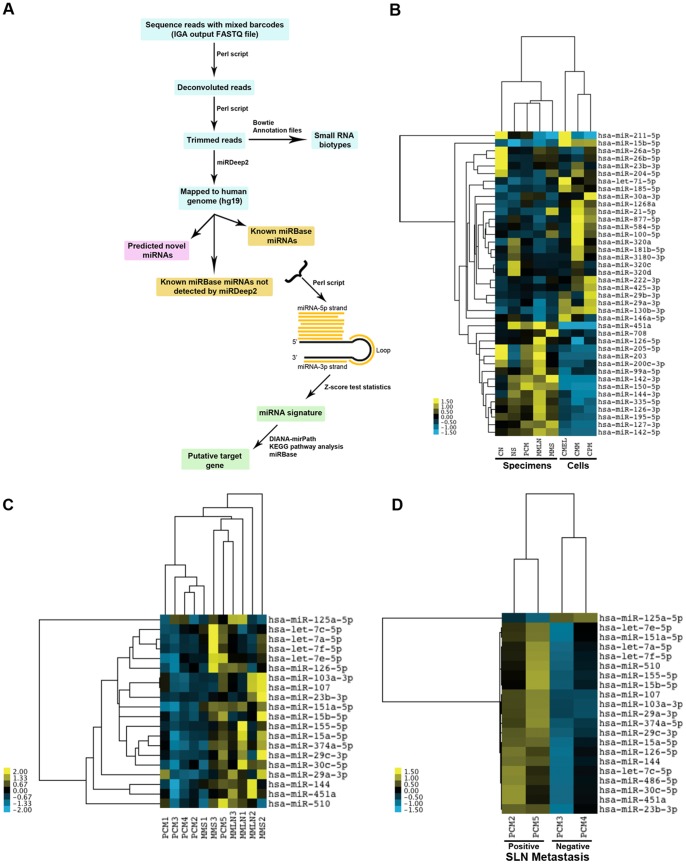
Figure 1. Bioinformatics pipeline, heat map-clustering analysis on top-40 miRNAs differentially expressed in melanoma specimens and cell lines.
The flowchart describes the programs and steps used to process the raw small RNA-sequence data to miRNA signature and target gene prediction (A). Clustering analysis of the top-40 miRNAs identified by NGS appropriately segregated primary cutaneous melanoma (PCM), normal skin (NS), common nevus (CN), metastatic melanoma to lymph node (MMLN) and metastatic melanoma to skin (MMS); and cultured primary melanoma (CPM), cultured metastatic melanoma (CMM) and cultured melanocytes (CMEL) (B). The miRNA signature for melanoma specimens is dramatically dissimilar to cell lines. A clustering analysis using 698 distinct mature known miRNAs appropriately segregated PCM from MMLN from MMS (C) and correctly segregated two melanoma patients with biopsy-proven microscopic metastasis to sentinel lymph node (SLN) from two melanoma patients without metastatic disease (D).

