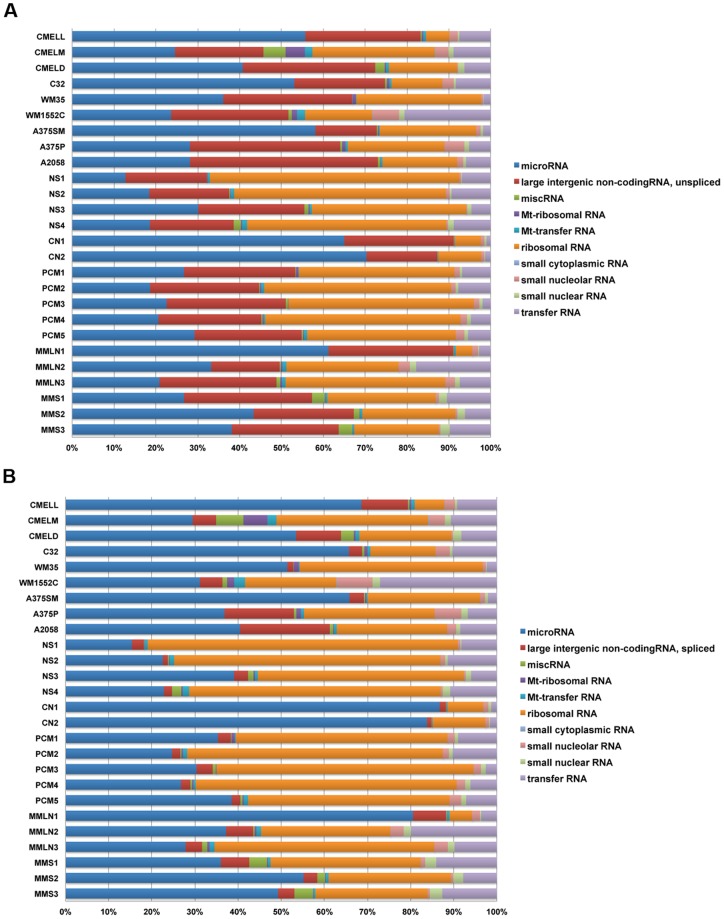
Figure 5. Frequency of small RNA classes in melanoma specimens and cell lines.
The stacked bar charts represent an overview of the small RNA abundance (shown in percentages) in all libraries. miRNA, ribosomal RNA and unspliced lincRNA subclasses represented the largest subclasses among the small RNAs. The overall percentage of miRNAs showed an increase when comparing unspliced (A) to spliced lincRNA (B) bar charts.

