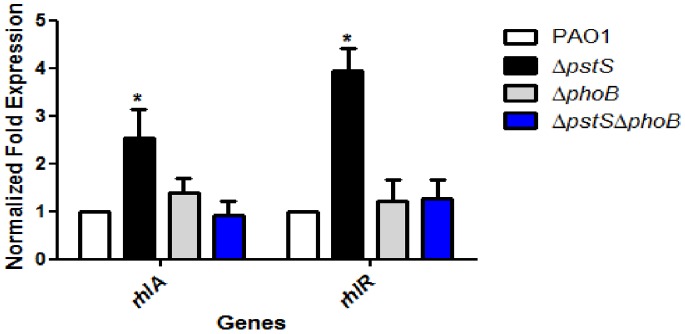
Figure 3. pstS knockout results in elevated rhlA and rhlR expression.

PAO1, ΔpstS, ΔphoB and ΔpstSΔphoB were grown for 48 hours at 37°C with shaking in M9 medium. Levels of rhlA and rhlR were measured by Real-Time PCR as described in Materials and Methods. Values were normalized to the expression of PA1769. The results shown are relative to PAO1 and represent mean+standard deviation of nine different experiments. Each experiment was performed in triplicate. Asterisks represent the significant elevation in rhlA and rhlR transcription compared to the WT (p<0.05, student’s t-test).
