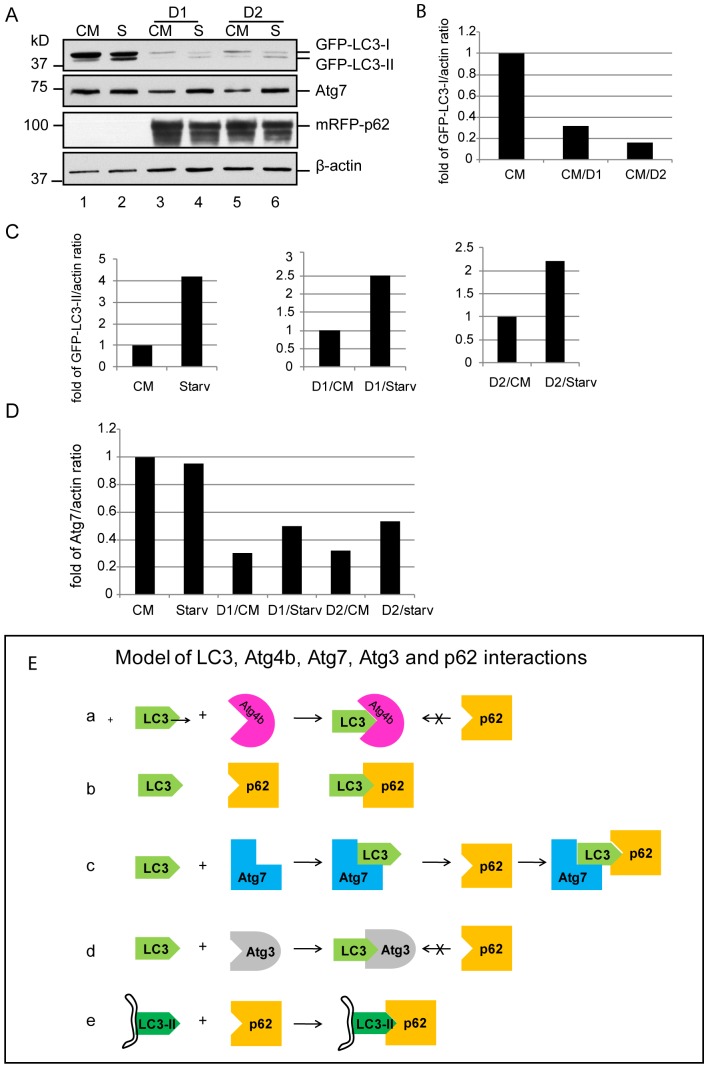
Figure 9. (A) p62 aggregates’ effect on cytosolic LC3 and Atg7 levels. A549 cells stably expressing GFP-LC3 were infected with Ad-mRFP-p62 at 20 MOI (D1) and 10 MOI (D2) for 48 h.
Cells were then cultured in nutrient-rich media or starved in EBSS for 2 h. Total cell lysates were centrifuged at 15,000 g to separate p62 aggregates. The supernatants were used for immunoblot assays as indicated. Image J was used to quantify the related band densities using β-actin as a loading control. Relative band intensity of protein of interest was divided by the correspondent band intensity of β-actin. Fold of increase or decrease was then determined by setting the control sample as 1. CM = complete media. S = starvation. (B) Summary of p62 interaction with LC3. As Atg4B occupies or blocks the binding site for p62, there is no interaction between p62 and LC3 (a). Atg7 binds LC3 but does not block the p62 interaction domain allowing the interaction of p62 and LC3 (b). As Atg3 occupies or blocks the binding site for p62, there is no interaction between p62 and LC3(c). Membrane bound LC3-II exposes the binding site for p62 after it is converted from the LC3-Atg3 and becomes the receptor for p62.

