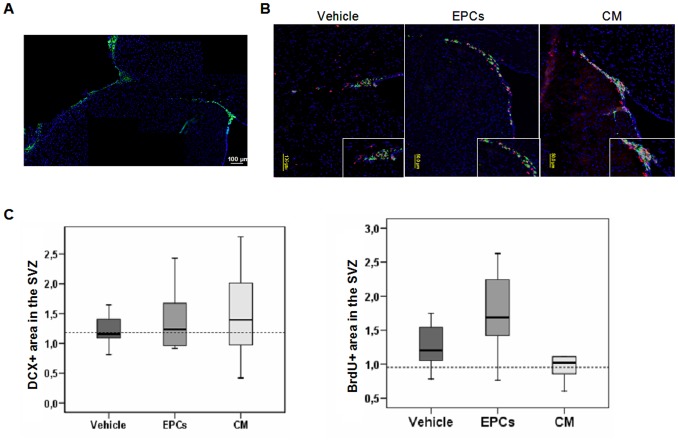
Figure 4. Immunofluorescence images showing neurogenesis at two weeks in the SVZ.
Composition of four immunofluorescence images for DCX (green) and DAPI (blue) showing neuroblast migration from the SVZ towards cortical peri-infarct thorough the corpus callosum external capsule in an EPC-treated animal (A). Representative images of double immunofluorescence for DCX (green), BrdU (red) and DAPI (blue) are shown for the different treatment groups (B). Bottom right inserts show a magnification of the dorsolateral SVZ. Box-plots representing the percentage of DCX+ or BrdU+ area in the SVZ (n = 11 for vehicle, n = 11 for EPCs, n = 11 for CM and n = 3 for shams) (C); data is represented as median (IQR).

