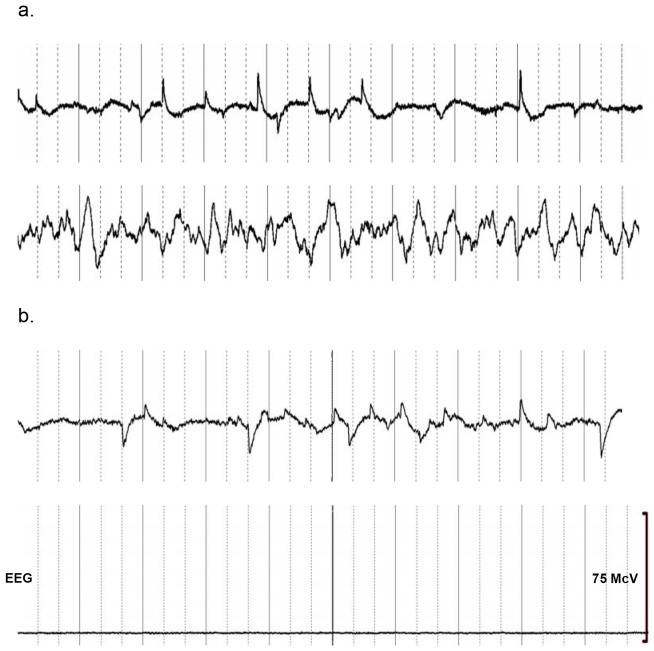
Figure 1. Four 30 second segments of EEG Data.
A. Two segments of data recorded in non-torpid sleep in Duke Lemur Center. The top segment displays EEG data during a period of REM sleep. The display scale is 250 µV from the top to the bottom. The bottom segment displays EEG data during a period of Non-REM sleep. The display scale is 150 µV from the top to the bottom. b. Two 30 second segments of EEG data recorded during torpor in the wild verified by decreased metabolic rate. The top segment includes REMs. The display scale is 250 µV from the top to the bottom. The bottom segment is typical monotonous very low-voltage activity seen through much of these recordings and the display scale is 75 µV from the top to the bottom.

