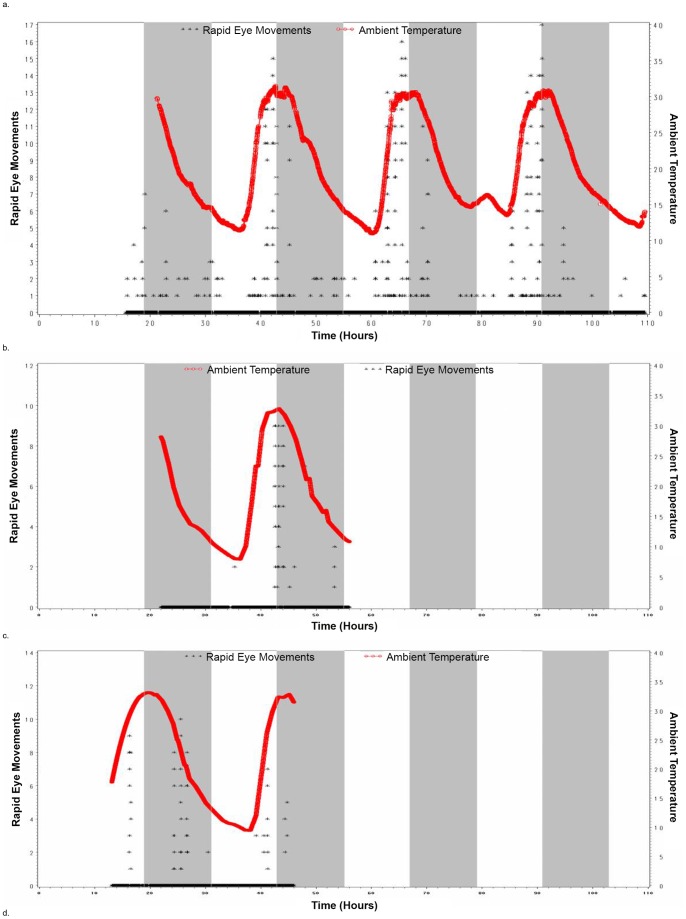
Figure 4. REMs per 30 second epoch and Ambient Temperature vs Time of Day in Hours in 6 C. medius studied in the wild in Madagascar.
The top panel of the figure represents data from the animal documented to be in torpor with metabolic measurement. Note: the periods where EEG data were available for each animal coincides with the time-points where Ambient Temperature data is included in the graphs. Graphs a-f depict these data for Lemurs 1–6 respectively as designated in Table 1. Note: Because we have plotted a data point for every 30 second period over the roughly 4 days of data depicted, data from adjacent 30 second epochs which have the same or nearly the same value will appear to be on top of each other.

