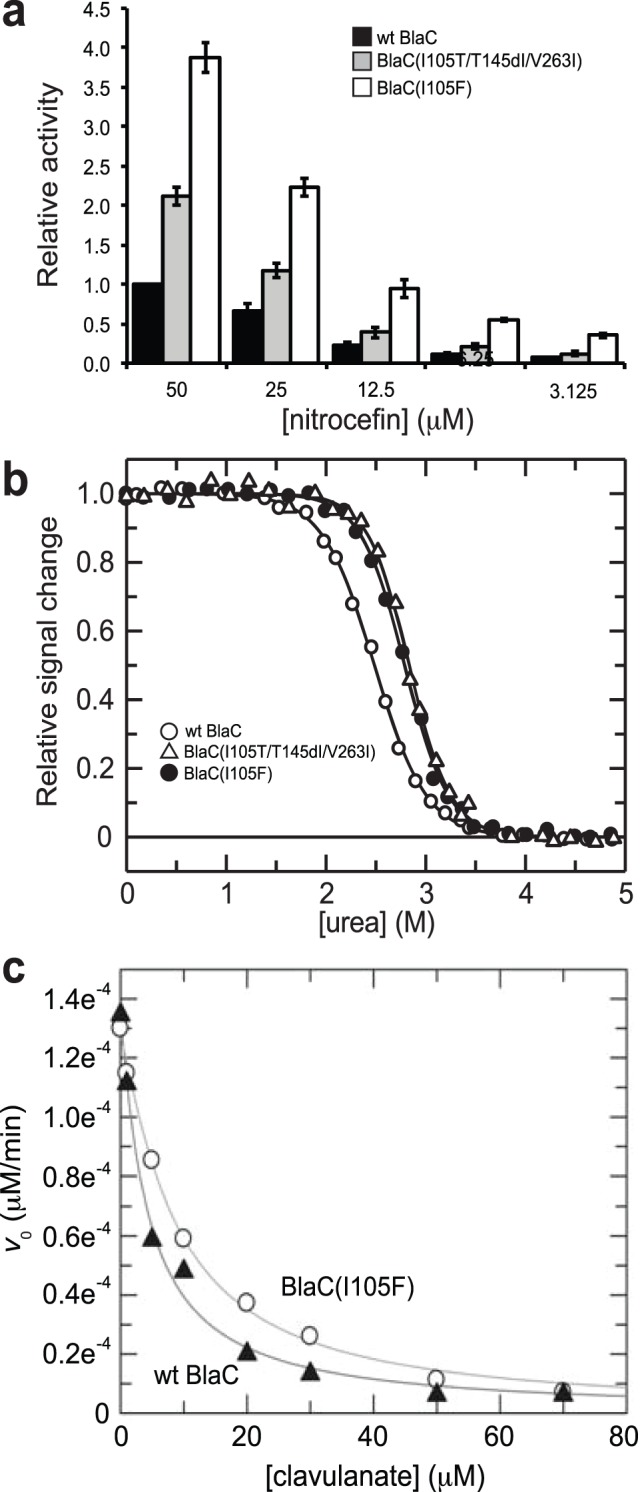
Figure 3. Characterization of BlaC enzymes.

(a) Nitrocefin hydrolysis activity in cell lysates. Data was normalized to the activity measured in cells expressing wt BlaC. Data represents the average of 3 replicate experiments and the error bars represent the standard error of the mean. (b) Equilibrium unfolding transitions of purified enzymes. (c) Inhibition of wt BlaC and BlaC(I105F) enzymes by clavulanate measured using nitrocefin as substrate.
