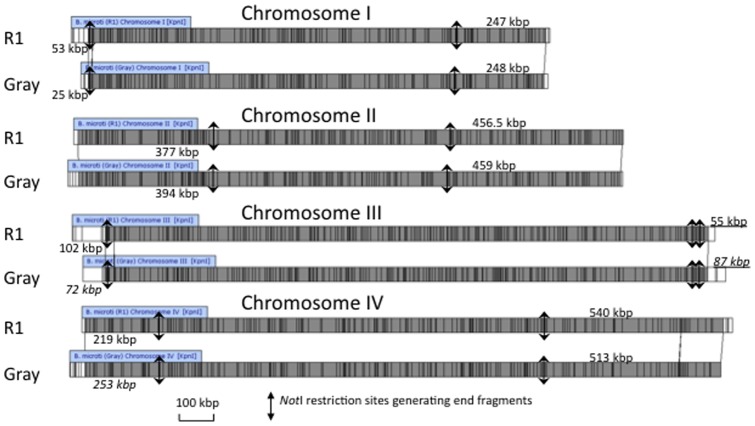
Figure 5. Comparison of the Whole Genome maps (WGM) of each chromosome of the R1 and Gray strains.
Restriction sites are shown as vertical lines within each WGM. Differences between maps are indicated by the alignment connectors. The regions of the chromosomes that are different between the two WGMs are shown in white. The NotI restricted site and predicted size of the restriction fragments are represented for each extremity. Underlined values are calculated according to the predicted position of the NotI site.

