Fig. 1.

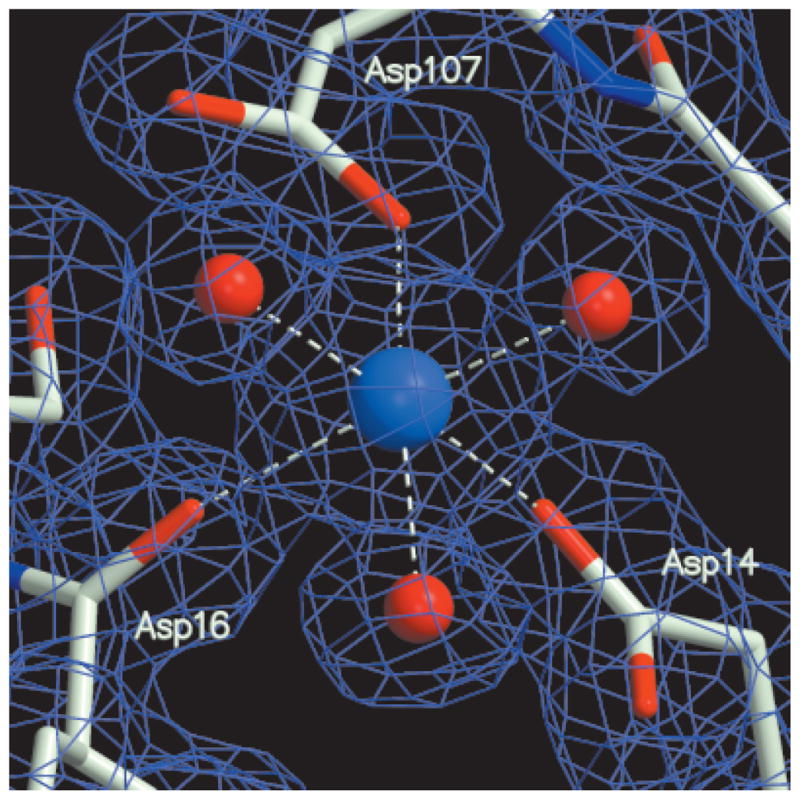
Electron-density maps (1.67-Å resolution) together with the final model. The active-site Co2+ region is shown. The coefficients (2Fo − Fc) and calculated phases are used. The map is contoured at the 1σ level.

Electron-density maps (1.67-Å resolution) together with the final model. The active-site Co2+ region is shown. The coefficients (2Fo − Fc) and calculated phases are used. The map is contoured at the 1σ level.