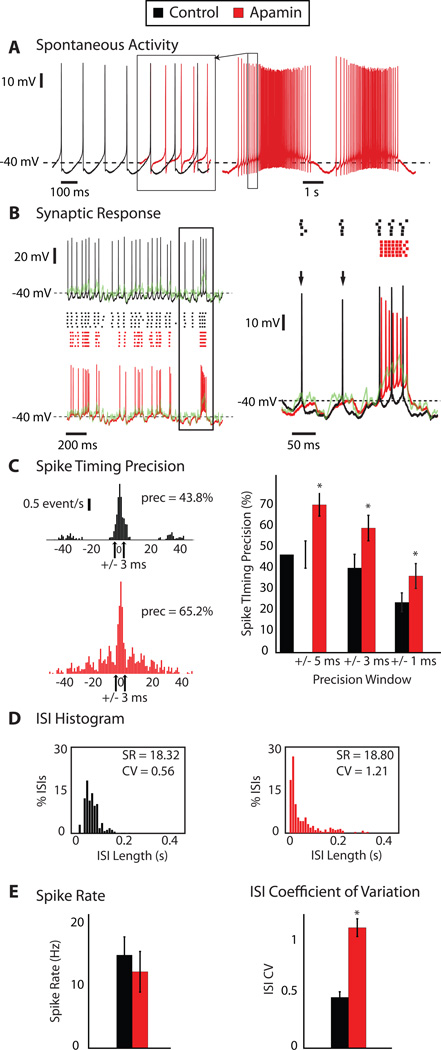
Figure 2. SK Block by apamin alters the spike response pattern elicited by synaptic input applied via dynamic clamp.
A: Spontaneous activity of a CN neuron before (black) and after superfusion of 100 nM apamin (red). A segment of the spike train after apamin block was superposed on the control spike train to allow direct comparison of the AHP waveform at a comparable spike rate (red overlay demarcated by box) B: Stimulus aligned voltage responses to a synaptic conductance input pattern applied via dynamic clamping on the left before (black) and after apamin (red) superfusion. Spike raster plots for 5 stimulus repetitions are shown in the center and the temporal waveform of the combined reversal potential of inhibition and excitation (Esyn) is shown in green. On the right is an expanded inset of the boxed area overlaying the voltage traces. The loss of certain isolated spike events (arrows) and the presence of fast frequency spiking with a large depolarizing stimulus event are evident after the application of apamin. C: Spike timing cross-correlograms reveal time-locked responses to specific input events across trials. On the left are cross-correlograms of the spike responses across 5 repeated applications of the same synaptic conductance waveform applied both before (top) and after apamin presentation (bottom). For a precision window of +/− 3 ms, this neuron had 43.8% of spikes repeated at the same time across trials in the baseline condition and 65.2% following apamin. On the right are the percentages of aligned spikes for +/− 5, 3, and 1 ms precision windows for 8 recorded neurons. For all tested precision windows, the SK blocked condition yielded significant higher spike precision values (p < 0.05, N=8). D: Histograms of inter-spike intervals (ISIs), with a 10 ms bin, of a neuron’s responses to dynamic clamp-applied synaptic input. High frequency bursts elicited by larger depolarizing events lead to an increase in the percentage of the shorter ISIs (that of the 10 ms or less bin rises from zero to ∼18%). The loss of some responses to smaller synaptic events leads to an increase in the number of longer ISIs as well. The shift in the ISI distribution leads to a large change in the coefficient of variation (ISI-CV), from 0.535 to 1.21, while the SR is nearly unchanged after apamin presentation (18.32 Hz vs. 18.8 Hz). E: For all 8 quantitatively analyzed neurons, SR remains statistically unchanged while ISI-CV increases significantly (p < 0.001) after apamin presentation as a result of the combination of the antagonistic effects seen in (B) and (D).

