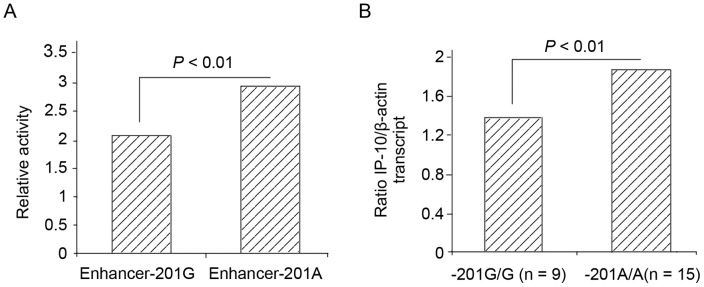
Figure 1. Correlation of IP-10 expression with the allele and genotype.

(a) Luciferase activity in HepG2 cells transfected with promoter-reporter vectors corresponding to -201GG or AA haplotype homozygotes, respectively. The vertical axis represents the relative proportion of luciferase activity to corresponding pGL3-enhancer vectors. Data represent mean of representative data from three experiments performed in quadruplicate. P values were estimated by Student t test. (b) Expression of CXCL10 measured by quantitative SYBR PCR of RNAs purified from peripheral blood mononuclear cells of 24 patients. Columns, mean from triplicate measurements; bars, SD.
