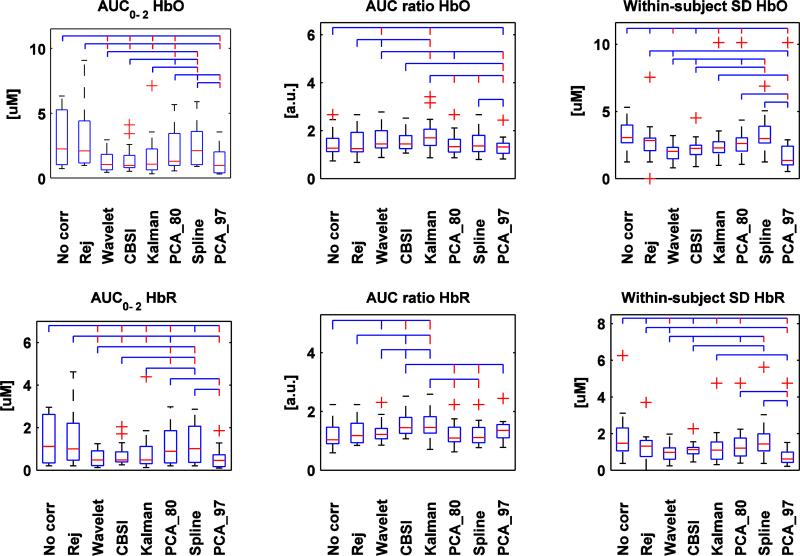
Fig.3.
Box plots of the AUC0-2, AUC ratio and within-subject SD computed for all techniques and for both HbO (upper row) and HbR (bottom row). The red line in the box plot indicates the median, while the two extremities of the box plot represent the first and third quartile. Red crosses indicate outliers. The lines above linking the different techniques represent the significant statistical difference (p<.05 if the line is blue, p<.01 if the line is red).

