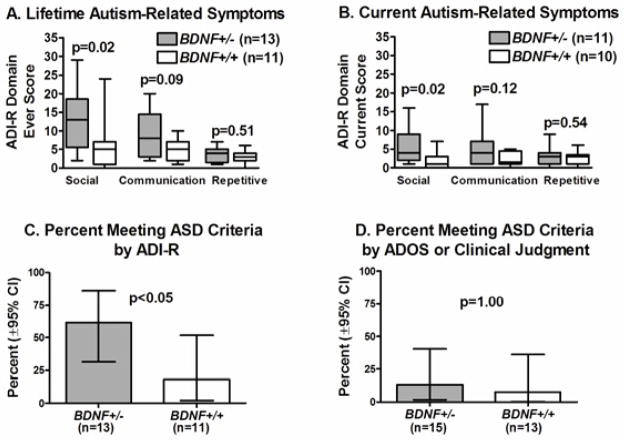
Figure 3.
Autism-related symptoms in subjects with WAGR syndrome. (A) Impairment scores using ADI-R ever codes. (B) Impairment scores using ADI-R current codes. (C) Percentage meeting ASD cut-off criteria using ADI-R ever codes. (D) Percentage meeting ASD cut-off criteria using ADOS or clinical judgment. For the box-and-whiskers plots, central line is the median, box indicates 25th–75th percentile, and whiskers show the range (minimum and maximum). Percentages meeting ASD criteria are shown with ± 95% confidence intervals.

