
Figure 4. Wnt4 misexpression reorients PCP during early pupal development.
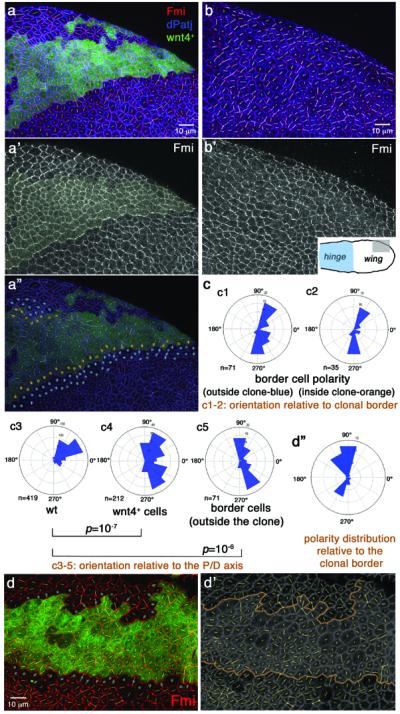
Panels show 16h APF pupal wings with Wnt4 misexpression clones (a-a” and d-d'; marked by GFP, green; yellow shading in a'). b-b': wild-type control for direct comparison. Inset in b' illustrates area displayed in a–b (hinge region marked blue). Anti-Fmi (red in multicolor panels, monochrome in a',b') and anti-dPatj (blue in a,a”,b) reflect cellular orientation (Fmi) and cell outlines (dPatj). Polarization (Fmi localization) was calculated/quantified as described37, illustrated as white or yellow lines in each cell: orientation of lines indicates polarity direction, length indicates strength of polarization/nematic order (see below). (a”) Cells bordering Wnt4 source, on inside and outside of clone, are highlighted with orange and blue dots, respectively; see (c) for orientation angles.
(c) Polarization of specific cell populations from (a–b) as labeled. c1, c2: polarity relative to clonal border; c3–c5: actual polarity as present in wing area (n=number of cells scored/rosette; 36 Wnt4 GOF clones were analyzed by Fmi staining, 5 independent wings were analyzed at this stage [15–16h APF] and 31 at later stages [see also Fig. 3]). Wnt4-misexpression affects cellular polarization autonomously (polarity distribution of Wnt4+ cells [c4] is different from wild-type [c3]; p=10−7 with two-sample Kolmogorov-Smirnov, see Methods) and non-autonomously: polarity of neighboring cells (2–3 rows marked by blue dots in [a”]) are distinct from wild-type in same region (c3 vs c5; p=10−6 with Kolmogorov-Smirnov) and near 90°/-90° relative to clonal borders (c1). Border cells inside clone (orange dots in a”) are also near 90° relative to clonal border (compare c2 and c1) and distinct from wild-type (p=10−5).
(d-d”) Different example of Wnt4+ clone at same stage. Note random polarity in clone and near 90°/-90° orientation of border cells relative to clonal border (blue dots in d; rosette in d”). 4/5 Wnt4 expressing clones analyzed at 15–17h APF altered Fmi polarization in neighboring cells.Nematic order, represented by length of polarity lines in each cell (see a–b) is affected by Wnt-expressing clones. Wnt4+ cells have reduced polarity vs non-wnt4 expressing (wild-type) cells (59.8+/−13.2 vs 72.1+/−15.8; p=0.005 with student t-test; average nematic order +/−standard deviation are shown), whereas border cells (blue/orange dots in a”) are more polarized (compared to Wnt4+ cells: 78.4+/−15.2 vs. 59.8+/−13.2; p=0.004; average nematic order +/−standard deviation; n=number of cells; 5 independent wings were scored).