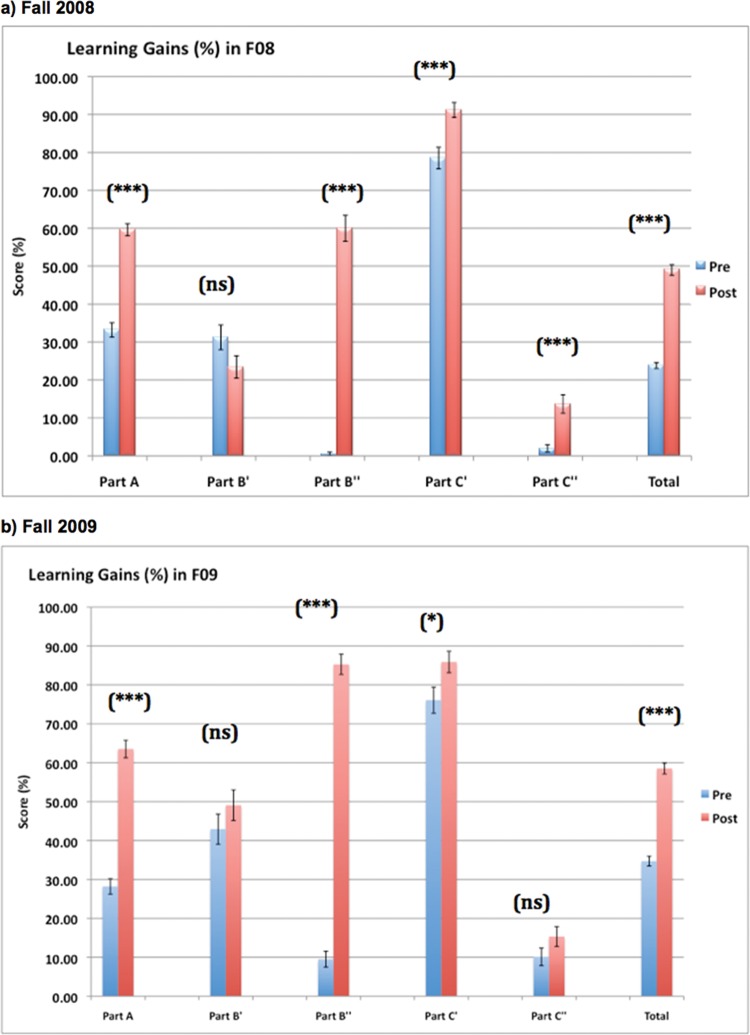
Figure 3.
Learning gains on the PhAT during (a) Fall 2008 (n = 205) and (b) Fall 2009 (n = 163). Pre- and posttest scores (mean values [%] ± SE) are indicated for each part of the PhAT, as well as the total score on the PhAT. Differences between pre- and posttest scores represent learning gains. *, significant at α = 0.05; **, significant at α = 0.01; ***, significant at α = 0.001; ns, not significant.

