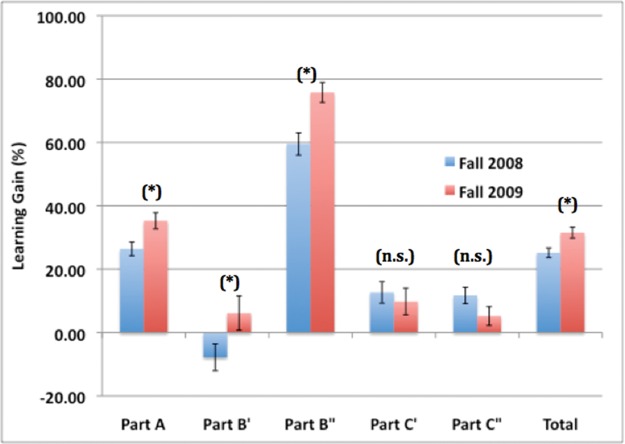
Figure 4.
Comparison of learning gains (%) on the PhAT during Fall 2008 (n = 205) and Fall 2009 (n = 163). Significant increases in learning gains were observed between Fall 2008 and Fall 2009 for parts A, B′, and B″ of the PhAT, as well as for the total score on the PhAT. Significance of differences across years was determined using t tests (two-tailed). *, significant at α = 0.05; **, significant at α = 0.01; ***, significant at α = 0.001; n.s., not significant.

