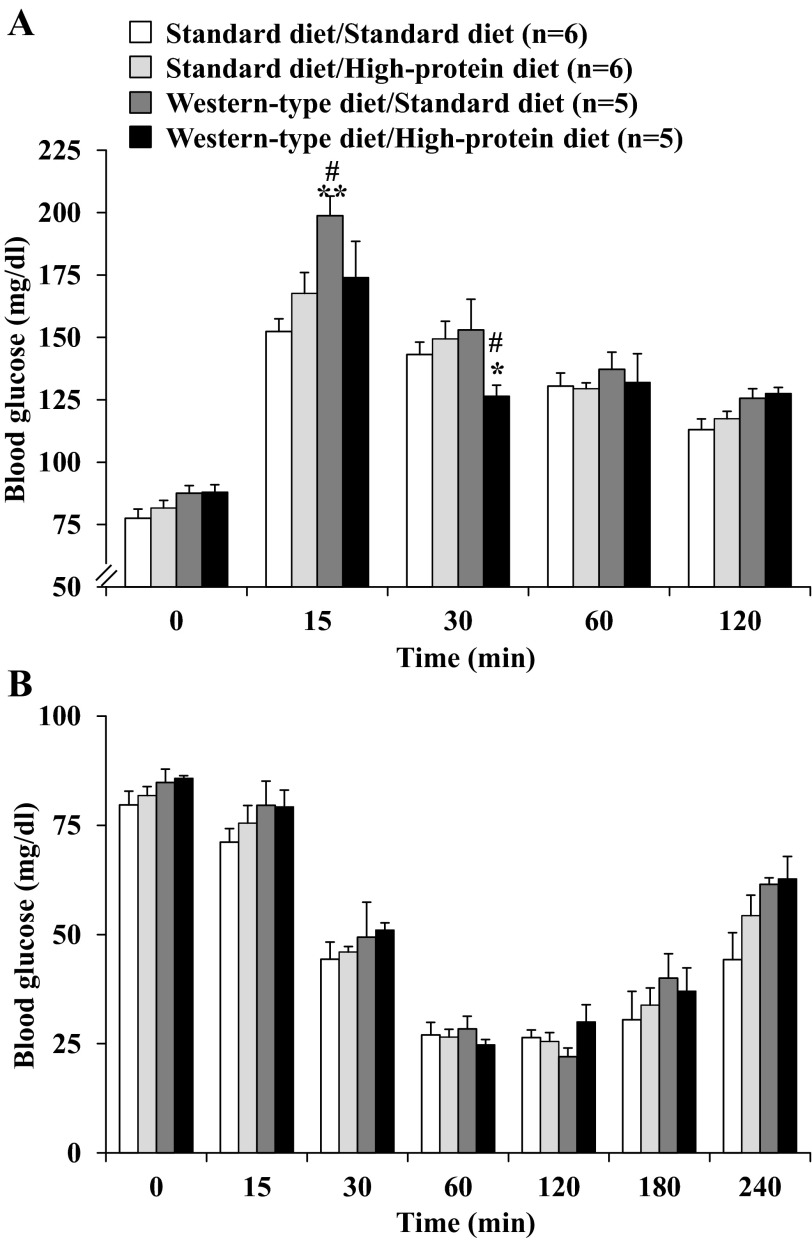
Fig. 6.
Glucose tolerance and insulin sensitivity after switching to standard diet or high-protein diet. For assessment of glucose tolerance, rats were food-deprived overnight with free access to water and received an orogastric gavage with 2 g·kg−1·4 ml−1 glucose in ddH2O. Blood was obtained by tail prick before and at 15, 30, 60, and 120 min after gavage, and blood glucose was assessed using standard glucose test strips (A). In the insulin sensitivity test, rats were fasted overnight and received an intraperitoneal injection of 1 IU·kg−1·ml−1 insulin. The experiment started at 9 AM, and blood glucose was assessed using standard glucose test strips before and at 15, 30, 60, 120, 180, and 240 min postinjection (B). Data are expressed as means ± SE of 5 or 6 rats/group. *P < 0.05 and **P < 0.01 vs. standard diet/standard diet. #P < 0.05 vs. standard diet/high-protein diet.

