
Fig. 2.
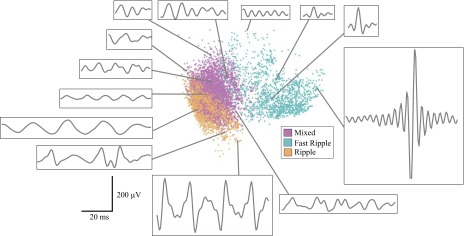
Scatter plot of all high-frequency oscillations (HFOs) in patient C in the first 2 dimensions of the principal components analysis (PCA) space. Each dot represents one HFO and is colored according to HFO cluster as determined by (Blanco et al. 2010). Localization of each dot corresponds to the first and second PCA components plotted in x–y coordinates. Representative waveforms from different regions of the PCA feature space provide examples of the morphology at each location.