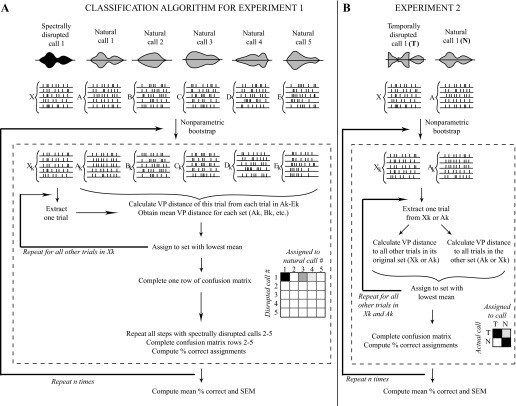
Fig. 1.
Procedure for comparing response sets to natural and disrupted stimuli using VP spike timing distance. A: classification algorithm used in experiment 1. Responses to spectrally disrupted calls were quantitatively compared with those to natural calls using VP spike timing distance. The response to each trial of a disrupted call was assigned to the set of natural call responses that were least different according to this metric, allowing the completion of a confusion matrix, where the strength of shading corresponds to the percentage of calls assigned. Perfect classification performance would result in a confusion matrix with darkly shaded squares along the diagonal from top left to bottom right, with all other squares unshaded. B: classification algorithm used in experiment 2. Responses to a temporally disrupted call were compared with those to the natural version of the same call using a similar procedure as in experiment 1. If the response to a disrupted call was fully confusable with that to the natural call, ∼50% of trials would be assigned incorrectly, resulting in an evenly shaded 2 × 2 confusion matrix. Perfect classification would result in a 2 × 2 matrix with the top left and bottom right square fully shaded, and the other 2 squares unshaded. In both A and B, n refers to the number of iterations of bootstrapping (refer to methods).

