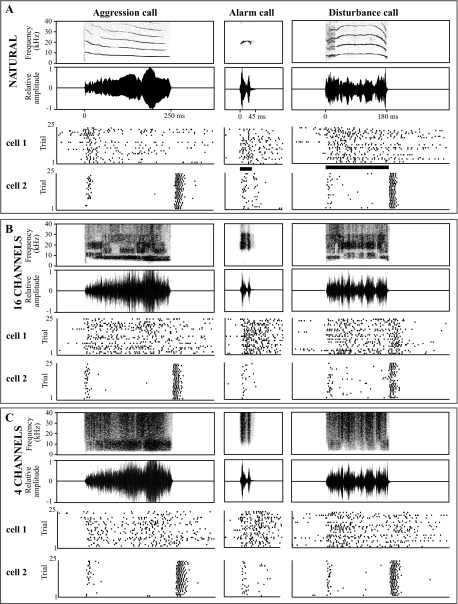
Fig. 3.
Example responses of neurons to spectrally disrupted calls. Spectrograms (top rows in A–C) and oscillograms (second rows in A–C) of 3 example vocalizations are followed by the responses of 2 example neurons (cell 1 and cell 2). A: natural calls. B: spectrally disrupted calls with 16 spectral channels. C: spectrally disrupted calls with 4 channels.

