Fig. 8.
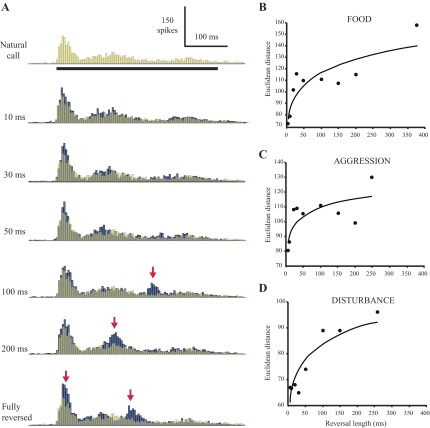
Temporal disruptions alter population responses to locally reversed calls. A: pooled response of 15 cells to the locally reversed food call sequence. Peristimulus time histograms of individual cells were aligned by stimulus onset, binned at 5 ms, and summed; reversal lengths are indicated to the left of each histogram. The natural call response has been made semitransparent and superimposed on the locally time-reversed call responses for ease of comparison. Right: quantitative comparison of pooled population responses to natural and locally reversed calls. B: food call; n = 15 cells. C: aggression call; n = 8 cells. D: disturbance call; n = 10 cells. Pooled histograms of population responses were binned at 5 ms, and Euclidean distance was calculated between the response to each manipulated call and the natural call response. Points were fit with a power function (R2 = 0.78, 0.58, and 0.80 for B, C, and D, respectively). Due to a small sample size (n = 4 cells), pooled responses to the final tested call, the mating call, were not analyzed.

