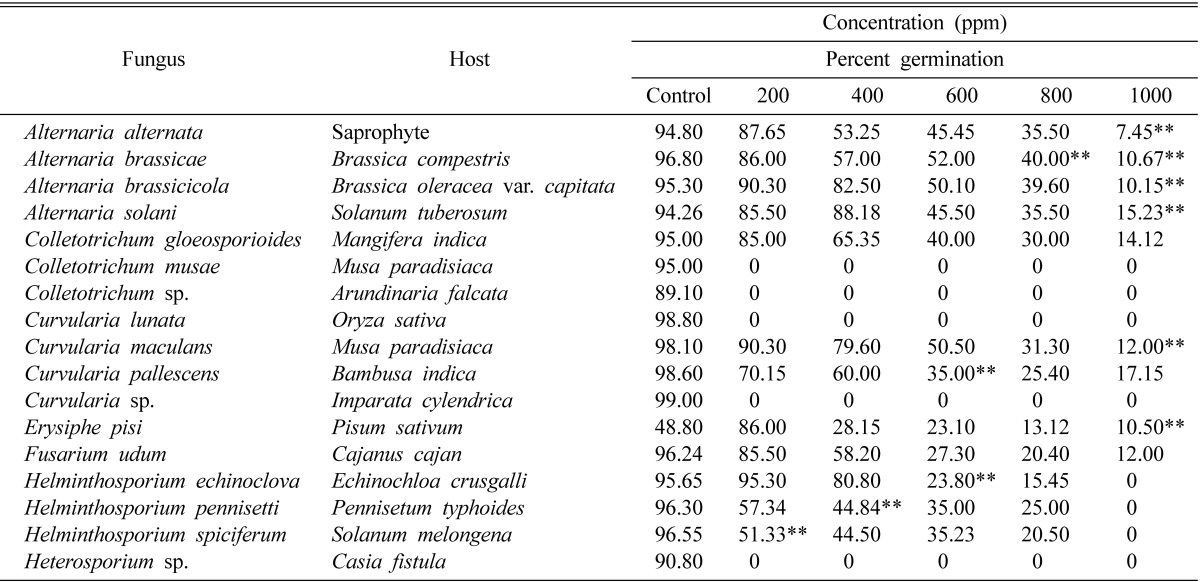
Table 1.
Effect of allosecurinine on spore germination of some fungi

aValues with double asterisk are significantly different from corresponding control values at p ≤ 0.01 based on the Student t-test. C.D. at 1% = 45.45.
Effect of allosecurinine on spore germination of some fungi

aValues with double asterisk are significantly different from corresponding control values at p ≤ 0.01 based on the Student t-test. C.D. at 1% = 45.45.