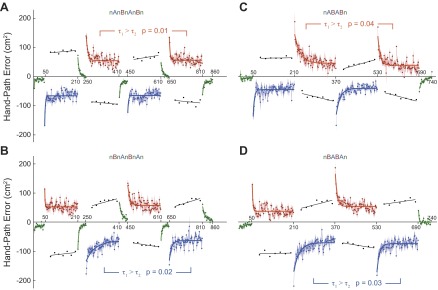
Fig. 4.

Hand-path error as a function of trial pair (dots), averaged across subjects. Shaded areas denote SE. A single rate exponential function (solid lines), fitted to the perturbation errors, suggests faster relearning at reexposure. Green, null trial; blue, force pairing A; red, force pairing B. Black dots represent catch trials, and black solid line presents their best fit line. A: subject group 1. Comparison of field B exposures (RI). B: subject group 2. Comparison of field A exposures (RI). C: subject group 3. Comparison of field B exposures (FI). D: subject group 4. Comparison of field A exposures (FI).
