
Figure 3.
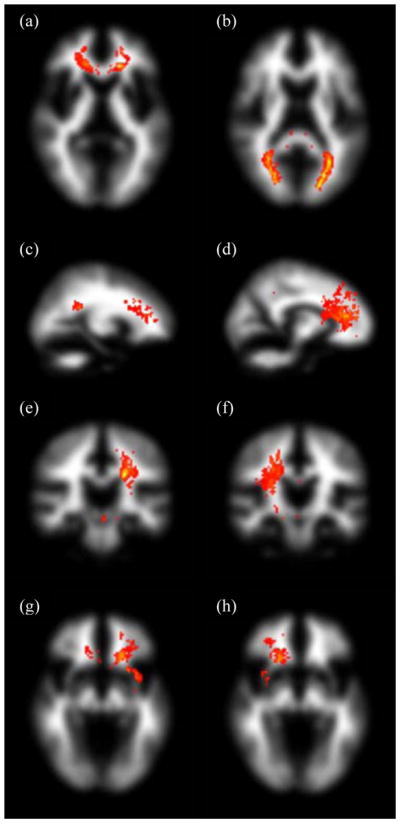
Maximum intensity projections of standard space group maps of the intersection between segmented fasciculi-of-interest and white matter lesion location overlaid on an MNI white matter volume for the 32 subjects with significant lesion load. The tracts displayed are genu and splenium (a, b; axial), left and right cingulum cingulate gyri (c, d; sagittal), left and right corticospinal tracts (e, f; coronal), and left and right uncinate fasciculi (g, h; axial). The windowing level is the same across all eight tracts, with ‘hotter’ colours indicating larger values of the product of the tract and white matter lesion group maps.