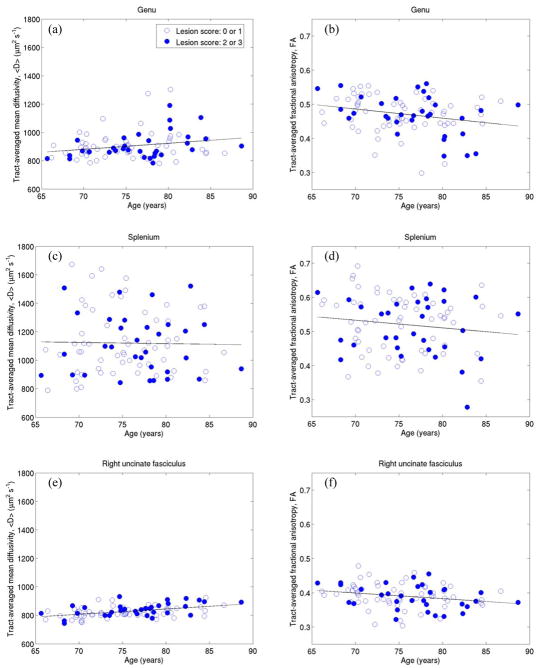
Figure 6.
Correlations between tract-averaged mean diffusivity (a, c, e), fractional anisotropy (b, d, f) and age for genu (first row), splenium (second row) and right uncinate fasciculus (third row). Open circles indicate subjects with few or no lesions in deep and periventricular white matter, while closed circles indicate subjects with significant lesion load.

