
Figure 3.
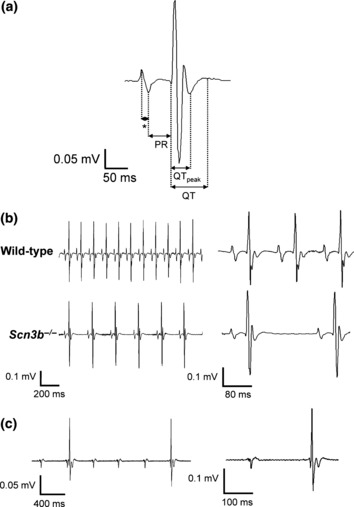
Surface ECGs from anaesthetized wild-type (WT) and Scn3b−/− mice. (a) Single electrocardiographic PQRST complex obtained from a WT mouse. The asterisk (*) represents the P wave. (b) Representative ECG recordings obtained from WT (top panel) and Scn3b−/− mice (bottom panel). Scn3b−/− mice (n = 5) consistently showed a slower heart rate and prolonged PR interval compared to those shown in WT mice (n = 7, P < 0.001). (c) ECG from a Scn3b−/− mouse that showed ventricular, QT complexes, that were independent of the atrial, P, waves. Despite the regular interval between the P waves, the intervals between the QT complexes were irregular. ECG traces are also shown at a faster time base (b and c: right panels).