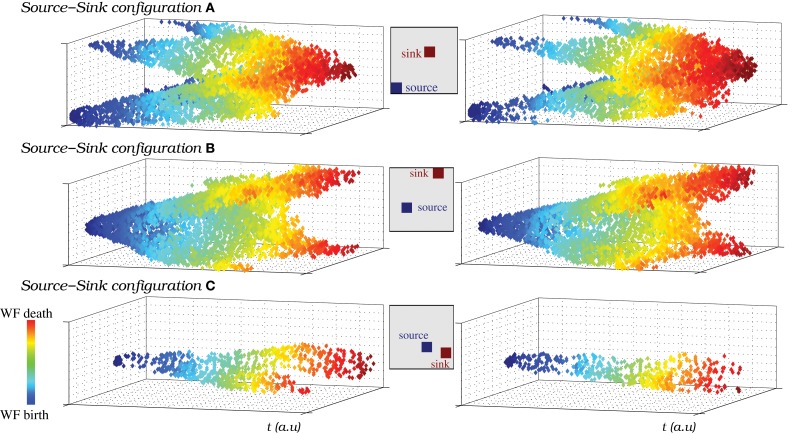
Figure 11.
(A–C) The source-sink phenomena allows the IO network models to generate spiking wave fronts from different regions and attract them to specific regions. To represent the pathways followed by the spatio-temporal patterns generated in a network model, we plot the IO cells that are over the firing threshold in each moment, from the wave front birth to its death. y and z axes represent the neuron coordinates in the IO network (50 × 50 square shaped), while x axis represents time evolution. Note that time is counted in terms of frames. The color code is used to illustrate the evolution of the wave fronts, blue corresponds to moments near their birth and red to moments near their death. We have selected three different pairs of locations for a single source and a single sink in the same IO network (also shown in Movie S9). A total of six pathways are shown in the figure, two examples for each pathway. The insets indicate the approximate location of the source and the sink in each case. The figure shows that the wave fronts are generated in the regions with a higher rate of spiking activity than the average population (sources), then travel through the IO network in different trajectories depending on the sink location and finally die in this region. Note the effect of the periodic boundary conditions of the network in this representation.

