Figure 12.
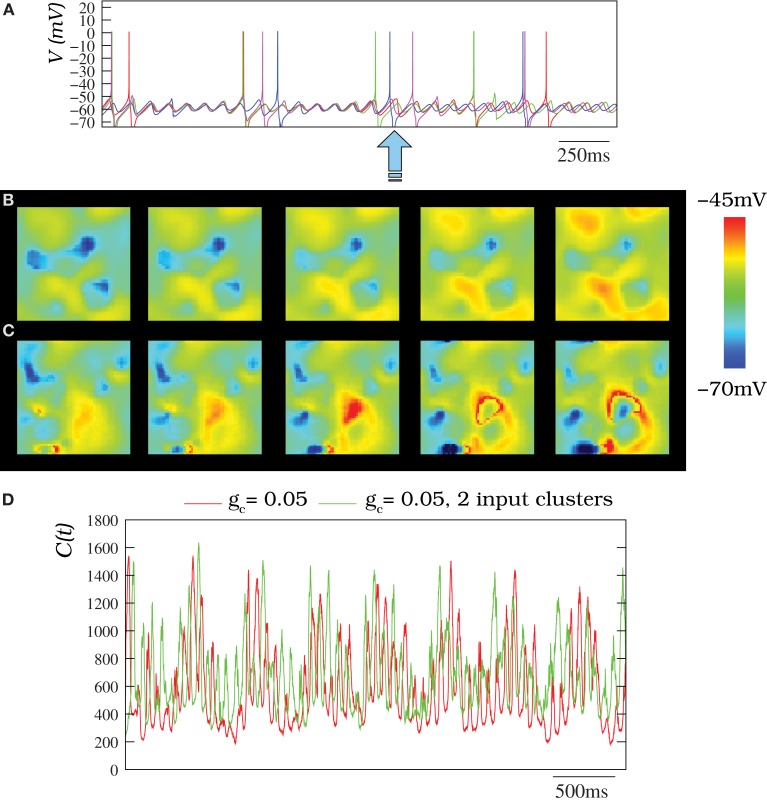
(A) Membrane time series for four randomly chosen neurons (the same as in Figure 4) within an IO network model of 50 × 50 units where the inhibitory loop is present. Each neuron is connected to its eight nearest neighbors with gc = 0.05 mS/cm2. In the absent of inhibition, subthreshold activity with a moderate coupling is quasi-synchronized (cf. Figure 4G). However, here, there exist transient desynchronizations induced by the inhibitory feedback from the IL (denoted by the arrow). (B) Spatio-temporal patterns observed in IO network model without external stimuli under the modulatory effect of the IL (snapshots of Movie S10). (C) Activity of an IO network with two clusters of neurons with an external stimuli (snapshots of Movie S11). In panels (B,C) the IO network topology and stimuli clusters are the same described for Figure 8A. Sequences develop in time from left to right with a time interval between frames of 3 ms. (D) Number of coefficients of the two-dimensional DWT that are bigger than 1 for different situations where the IL is present. The red trace corresponds to an IO network without stimuli where each cell is connected with its eight nearest neighbors with gc = 0.05 mS/cm2. The green trace corresponds to the same network but with two input clusters of 36 neurons with an injection of 0.25 μ A/cm2 and 0.5 μA/cm2. Note the IL induces an additional spatial modulation in the IO network activity. Nevertheless, the spatio-temporal patterns generated by the IO network do not disappear.

