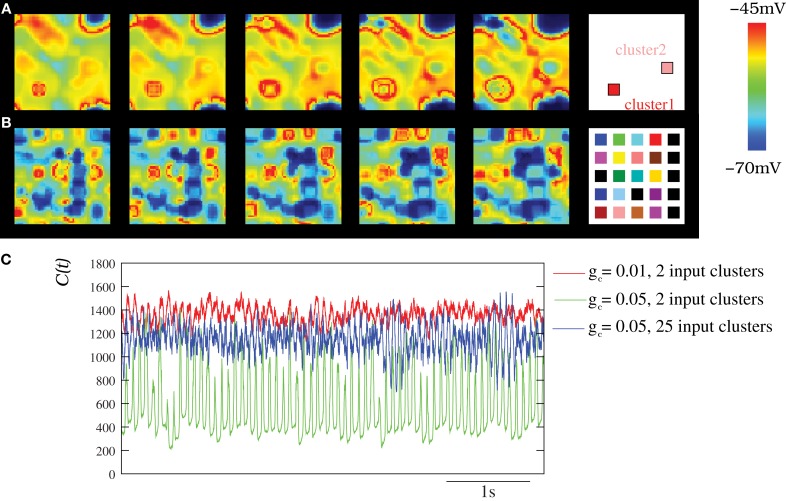
Figure 8.
Spatio-temporal patterns induced by external stimuli in the IO network models. (A–B) Snapshots of Movies S6 and S7. Sequences develop in time from left to right with a time interval between frames of 3 ms. The snapshots illustrate how several structures with different frequencies can coexist simultaneously in the network when several stimuli are present. The number of connected neighbors in the IO network is eight with gc = 0.05 mS/cm2. Stimuli are introduced in the IO network by means of a constant current injection in different clusters of neighbor neurons (see the text). Panel (A) shows the activity of a network with two different clusters of 6 × 6 cells each with different stimuli (Iinj1 = 0.75 μA/cm2 and Iinj2 = 0.25 μA/cm2). Panels (B) shows the activity of a network with 25 different clusters of 6 × 6 cells with Iinj distributed over 0.1–0.75 μ A/cm2. The right panels display the approximate positions of the clusters within the network. Colors represent different current injections, and thus different spiking frequencies in these clusters. (C) Characterization of the IO activity with the DWT when the IO network received different external stimuli. The stimuli induces the coexistence of different spatio-temporal patterns with different frequencies and spatial organization (see Movies S6 and S7), which is reflected in a more complex evolution of the DWT coefficients whose shape characterizes the spatio-temporal pattern (cf. with Figure 6). Thus, the stimuli are encoded in these coexisting and coordinated spiking rhythms commensurate with the subthreshold oscillations. In all cases, each IO neuron is connected to its eight nearest neighbors with the electrical conductance indicated in each trace. Units are mS/cm2. Red trace corresponds to a network with 2 input clusters of 36 IO neurons in which an injection of 0.25 μA/cm2 and 0.75 μ A/cm2 was applied. Green trace corresponds to the same network but using a stronger coupling. Blue trace shows C(t) for a network with 25 clusters of 25 neurons each with different stimuli distributed over 0.1–0.75 μA/cm2.

