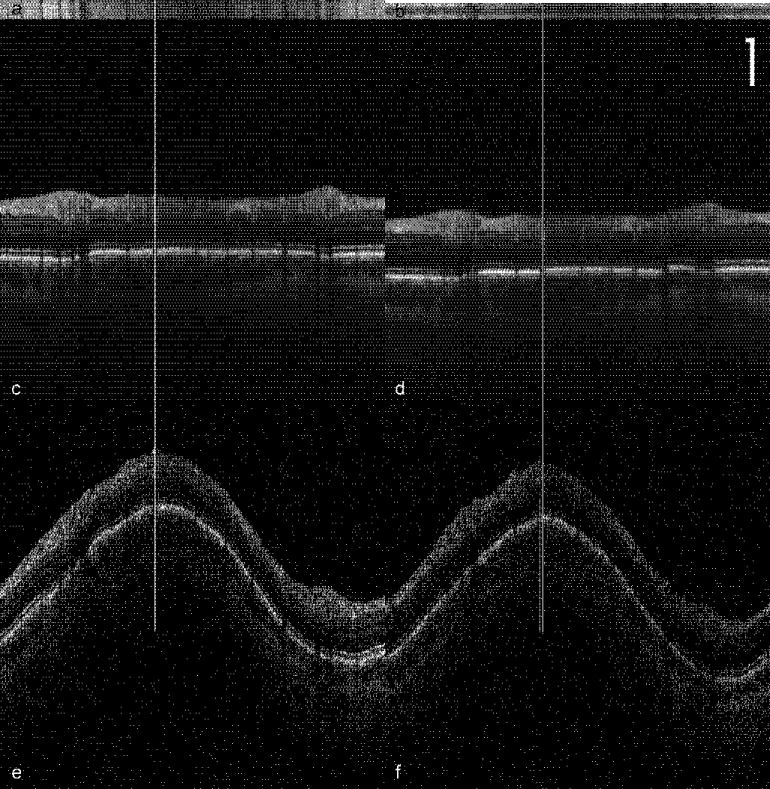
Fig. 4.

Peripapillary OCT scans comparing tracking (a,c,e) and non-tracking (b,d,f). 24 scans were collected sequentially. (a,b) Each horizontal line of the en-face profile was created by summing the A-scans in the frame. (c,d) Composite image created by aligning and co-adding all the frames. (e,f) Single frames used to create the composite images in c and d. Vertical lines show location of a blood vessel in single and composite images. Scale bar = 250 μm.
