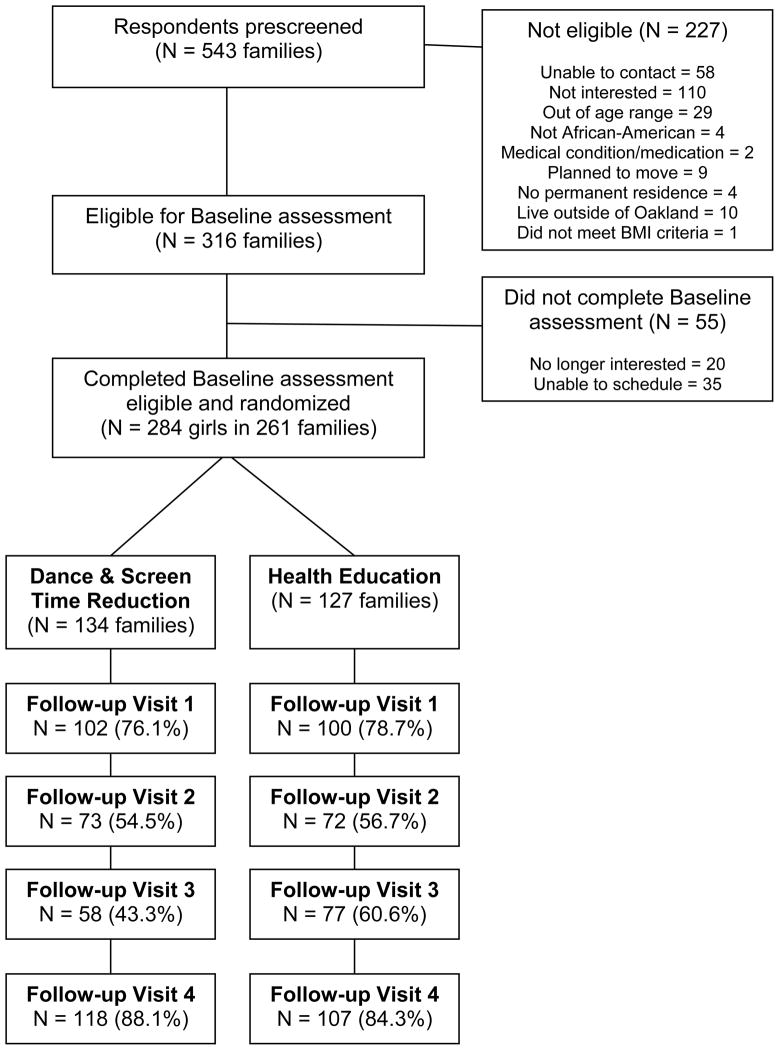
Figure 1. Participant Recruitment and Enrollment Flow Chart.
261 families/households with 284 eligible girls were recruited, enrolled and randomized in the trial from October 2002 thru February 2004. In families/households with more than one eligible girl, one girl was randomly chosen for the analysis sample of 261 girls. The only statistically significant difference in follow-up rates between groups was at FU3 (P=.005). Sixteen (11.9%), 27 (20.2%), 51 (38.1%), and 32 (23.9%) Treatment group girls and 15 (11.8%), 14 (11.0%), 39 (30.7%), and 49 (38.6%) Comparison group girls completed a total of 1, 2, 3 or all 4 of the follow-up visits (P = .053). Personnel difficulties with data collectors resulted in larger rates of missing data at FU2 and FU3.

