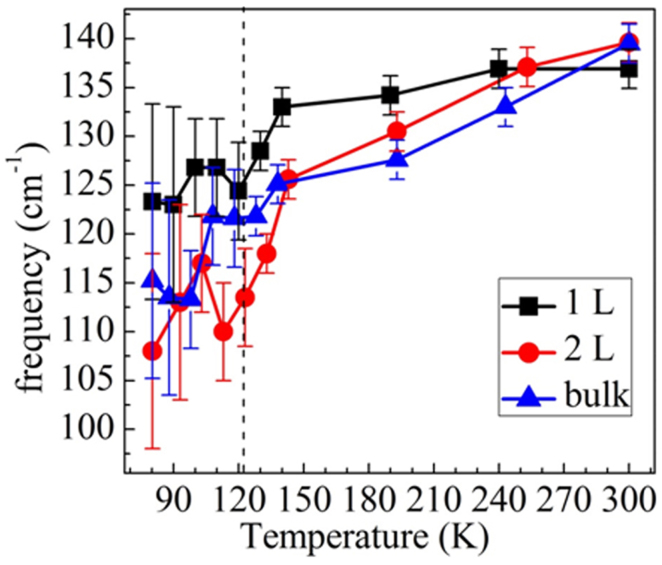
Figure 8. Observation of phase transition through sudden softening of two-phonon peaks.
In bulk samples, upon ICDW phase transition temperatures, the broad peak due to 2-phonon process broadens, softens in energy and intensity also decreases (black dashed line represents ICDW phase transition point for bulk at ~123 K). This broad peak is fitted by Lorenz function to obtain frequency corresponding to the center of the peak (the data below 120 K has huge error due to severely diminished Raman signal). As temperature approaches to Peierls phase transition point, 2-phonon peak for single layer and bilayer samples softens similar to bulk sample.

