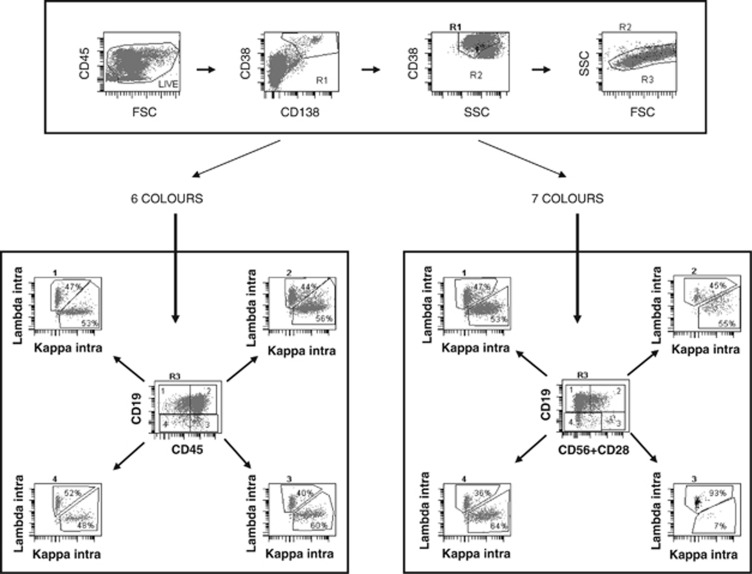
Figure 1.
Analysis of the data from a single-tube seven-colour staining with a six-colour strategy (left) or a seven-colour strategy (right). After defining a nucleated cell gate on a FSC/SSC scattergram and excluding debris on an FSC/CD45 gate, PCs are first included in a broad R1 gate encompassing CD138+/CD38++ or CD38− cells. This population is refined on an SSC/CD38 scattergram conditioned on R1, thereby defining gate R2. Cells satisfying both R1 and R2 are then displayed on an FSC/SSC scattergram and included in an R3 gate. For six-colour analysis (left bottom panel), cells in R3 are displayed on a CD19/CD45 scattergram, allowing to define four populations as shown in the centre of the panel. For each of them, a κ/λ scattergram is established to discriminate normal polyclonal PCs and MM-restricted PCs. The right bottom panel shows that, in the seven-colour strategy, intracytoplasmic light chain restriction is examined among four different populations, delineated on the basis of the expression or not of CD19 combined to the mixture of CD28 and CD56 (either or both antigens expressed when positive). CD45, which can be abnormally expressed on the clonal population as shown in the six-colour strategy, is examined on a different plot. In this sample (same list mode), the six-colour strategy fails to identify light chain restriction (MRD <0.24 × 10⁻⁴), whereas the seven-colour strategy reveals that 93% of the cells in subset 3 (CD19−/CD56/CD28+) use lambda chains, thereby characterizing abnormal PCs (MRD 1.25 × 10⁻⁴).

