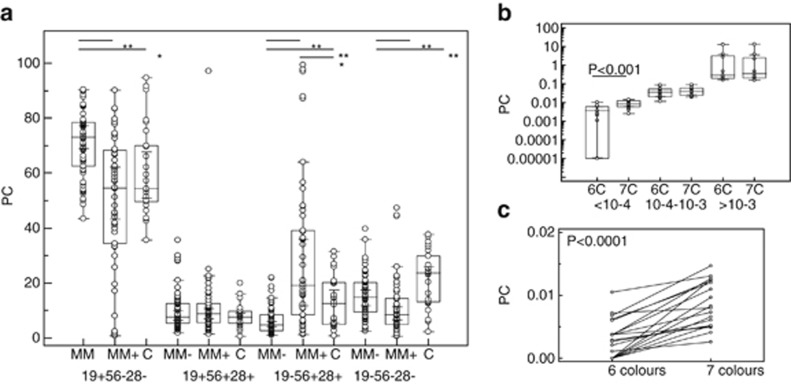
Figure 2.
(a) Partition of plasma cells within the four subsets defined in seven-colour staining, based on the expression or not of CD19 and/or CD28/CD56 within samples with no MRD (MM−), positive MRD (MM+) or from normal controls (C). Statistically significant differences are indicated by asterisks: **<0.0001, *<0.01. (b) Comparison of MRD results for the same listmodes interpreted with a six (6C)- or a seven (7C)-colour strategy. Data do not differ for samples with more than 1 × 10⁻⁴ cells, but the seven-colour strategy is more efficient to detect the lowest levels (**<0.0001). (c) Paired comparison of the 17 samples with positive MRD below 10−4 in the seven-colour strategy analysed in six (left) or seven (right) colours.

