
Figure 5.
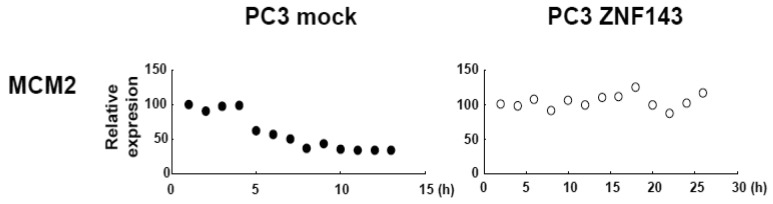

Fluctuations of nuclear expression of MCM proteins. Nuclear MCM2, MCM3, MCM5, MCM6 and MCM7 protein expression levels in Figures 2 and 3 were quantified using Multi Gauge Version 3.0. Closed circles and open circles indicate PC3 mock transfected and PC3 cells with forced expression of ZNF143, respectively.