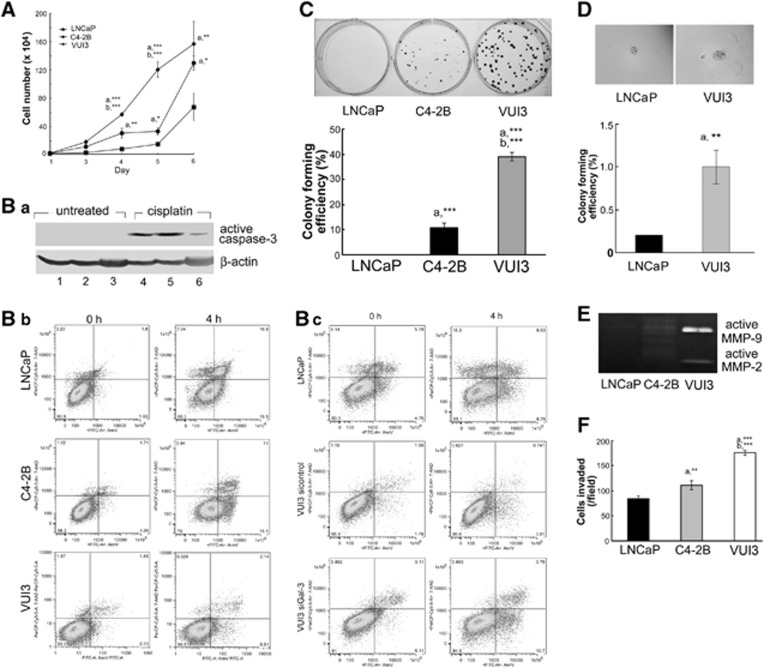
Figure 3.
More aggressive phenotype of prostate cancer cells expressing basal cell markers. (A) VUI3 cells had a higher growth rate. The alive cell number was counted using automated cell counter. (B) VUI3 cells were resistant to the chemotherapeutic drug cisplatin, and the resistance was reversed by Gal-3 knockdown. (Ba) Cells were treated with 50 μM cisplatin for 16 h and then subjected to western blot analysis of active caspase-3. β-Actin was used as the loading control. 1 and 4, LNCaP; 2 and 5, C4-2B; 3 and 6, VUI3. (Bb) FITC annexin V apoptosis detection. Cells were treated with 100 μM cisplatin for 4 h and then stained with FITC annexin V/7-AAD and analyzed by flow cytometry. Early-apoptotic cells were shown in the lower right corner of the image. (Bc) Gal-3 knockdown increased the number of apoptotic VUI3 cells in response to cisplatin. VUI3 cells were transfected with Gal-3 siRNA or control siRNA as described in the Materials and methods section. Thirty-eight hours later, cells were treated with 100 μM cisplatin for 4 h, stained with FITC annexin V/7-AAD, and analyzed by flow cytometry. VUI3 cells showed higher colony formation rate in six-well plates (C) and soft agar (D). Upper panel, picture of colonies; lower panel, the graph of colony-forming efficiency. (E) Gelatin zymography assay showed more active MMP-2 and MMP-9 in VUI3 cells. (F) Chemoinvasion assay showed more VUI3 cells invaded through Matrigel. (a) C4-2B or VUI3 versus LNCaP; (b) VUI3 versus C4-2B. Error bars represent S.D.; *P<0.05, **P<0.01, ***P<0.001. Data are representative of three independent experiments

