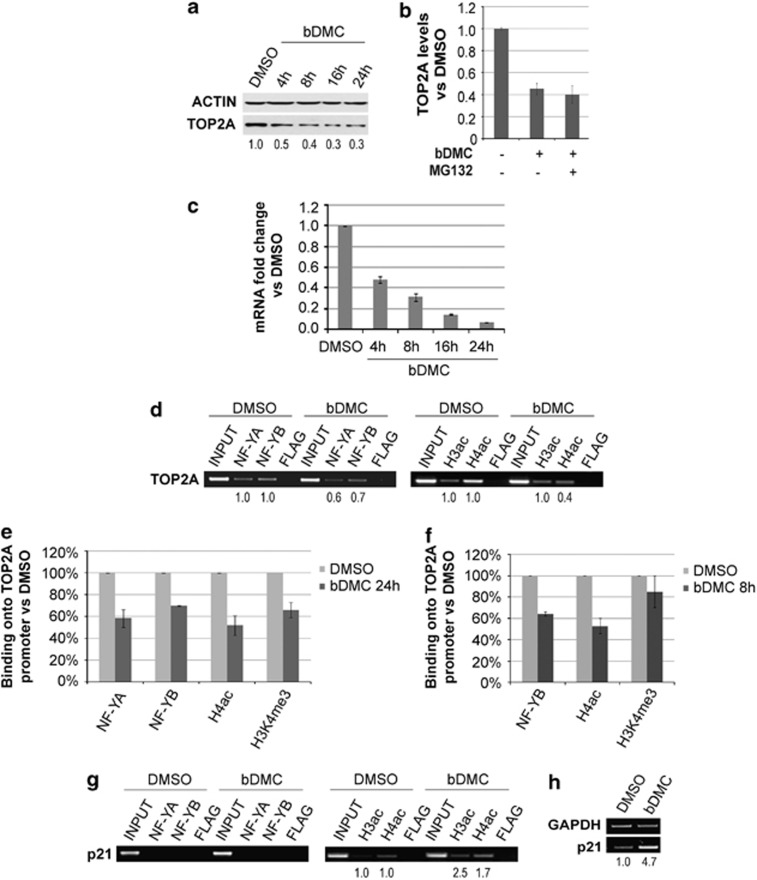
Figure 5.
Inhibition of NF-Y-mediated TOP2A transcription by bDMC. (a) TOP2A protein analysis in MNase-treated extracts following time course incubation with bDMC (30 μM). The indicated values represent the quantification of TOP2A immunoreactive bands of two independent experiments normalized to actin levels. (b) Quantification of TOP2A expression levels (normalized to actin) following bDMC and bDMC-MG132 administration for 24 h versus DMSO (arbitrarily set at 1). (c) Real-time analysis of TOP2A transcripts in cells treated with 30 μM bDMC, represented as mRNA fold change versus DMSO (arbitrarily set at 1). GAPDH has been used as internal control. The indicated values are mean of four independent experiments ±S.D. (d) ChIP semi-quantitative PCR analysis of NF-YA, NF-YB, acetyl-H3 and acetyl-H4 binding to TOP2A promoter in cells treated with DMSO or bDMC (30 μM) for 24 h. (e and f) ChIP real-time analysis of chromatin-associated NF-Y, acetyl-H4 and H3K4me3 to TOP2A promoter following 24-h (e) and 8-h (f) incubation with 30 μM bDMC. (g) Semi-quantitative analysis of the recruitment of NF-Y and acetylated histones on p21 regulatory region cells treated for 24 h with DMSO and 30 μM bDMC. (h) mRNA expression levels of p21 in 24 h bDMC-treated cells

