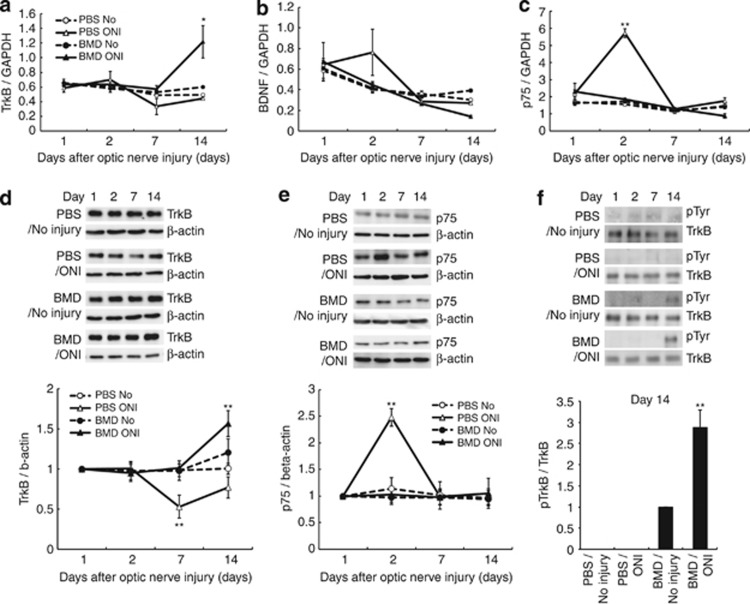
Figure 2.
Quantification of RNA levels in PBS- or brimonidine-treated retinas after optic nerve injury. (a–c) Relative mRNA levels were measured using real-time PCR. Total RNA from PBS- or brimonidine-treated retinas was analyzed 1, 2, 7, and 14 days after optic nerve injury (ONI). (a) TrkB, (b) BDNF, and (c) p75 RNA levels in PBS- and brimonidine-treated retinas. The relative expression levels were determined by normalization to the level in the intact retina. N=3–4. (d and e) Western blotting showing the temporal expression profiles of TrkB (d) and p75 (e) proteins. Lysates from PBS- or brimonidine-treated retinas were analyzed 1, 2, 7, and 14 days after ONI. Representative blots are shown (upper panels). The signal intensity was quantified by densitometry and normalized to β-actin levels. The relative TrkB or p75 protein levels are shown in the graphs. N=5–6. (f) The phosphorylation level of TrkB was determined by immunoblotting of the precipitated TrkB. N=5. *P<0.05, **P<0.01; one-way factorial ANOVA followed by Scheffé's multiple comparison test

