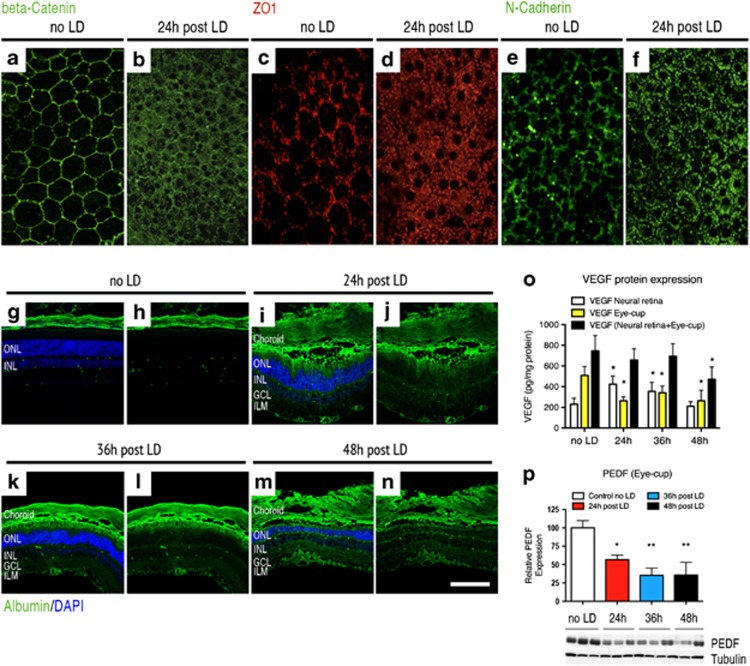
Figure 2.
VEGF-triggered RPE permeability is an early event in the light-damage model. Confocal analysis of tight- and adherens-junction markers performed on flat-mounted RPE revealed that RPE permeability is an early event in the LD model. Whereas the beta-catenin expression delineates the contour of RPE cells revealing their hexagonal shape on control unexposed to light (a), the expression of this marker was localized in the cytoplasm of RPE cells 24 h after LD (b). Similar results were observed concerning the expression of ZO-1 and N-cadherin markers. Normally located in the contour of RPE cells on control unexposed to light (c–e), both of these markers translocate in the RPE cell cytoplasm 24 h after LD (d–f) (n=6 per group – magnification × 400). Immunostaining of serum albumin, normally found in the choriocapillaris and in the retinal vessels located at the inner side of the retina of control unexposed to light (g and h), showed pronounced extravascular albumin leakage 24 (i and j), 36 (k and l) and 48 h (m and n) after light exposure. After LD, albumin was prominent in the RPE and in the outer nuclear layer (ONL). Albumin positivity was also found, to a lesser extent, in the outer plexiform layer (OPL), in the inner nuclear layer (INL), in the plexiform layer (IPL), in the ganglion cell layer (GCL) and, finally, in the inner limiting membrane (ILM), suggesting that plasma leakage originates from the outer BRB (n=6 per group—magnification × 400, scale bar: 100 μm in (g–n)—Green: albumin and blue: DAPI). (o) ELISA quantification shows that VEGF level was 1.8-fold and 1.5-fold increased, respectively, 24 and 36 h after LD compared with control unexposed to light in the neural retina (control no LD: 231.6±56.3 pg/mg protein; 24-h post LD: 423.5±79.3 pg/mg protein; 36-hour after LD: 353.8±87.7 pg/mg protein and 48-h post LD: 209.7±45.3 pg/mg protein). Contrariwise, in the eye-cup, VEGF content was significantly decreased 24, 36 and 48 h after LD compared with unexposed controls (control no LD: 508.9±96.2 pg/mg protein; 24-h post LD: 262.9±37.3 pg/mg protein; 36-h post LD: 340.7±88.8 pg/mg protein and 48-h post LD: 262.7±132.4 pg/mg protein). No obvious difference was observed concerning VEGF content in the whole eye, except at 48 h after LD. At this point, VEGF was 1.5-fold decreased compared with the control. Each bar represents the mean value±S.D. (n=6 per group). Statistical analyses: one-way ANOVA and Dunnett's post hoc test: *P<0.05. (p) Western blot analysis for PEDF in the eye-cup showed that PEDF expression was significantly reduced 24, 36 and 48 h after LD. Quantification is presented as relative expression normalized against values of tubulin controls to adjust for protein loading. Results are expressed as mean±S.D. (n=6 per group). Statistical analyses: one-way ANOVA and Tukey's post hoc test: *P<0.05 and **P<0.01

