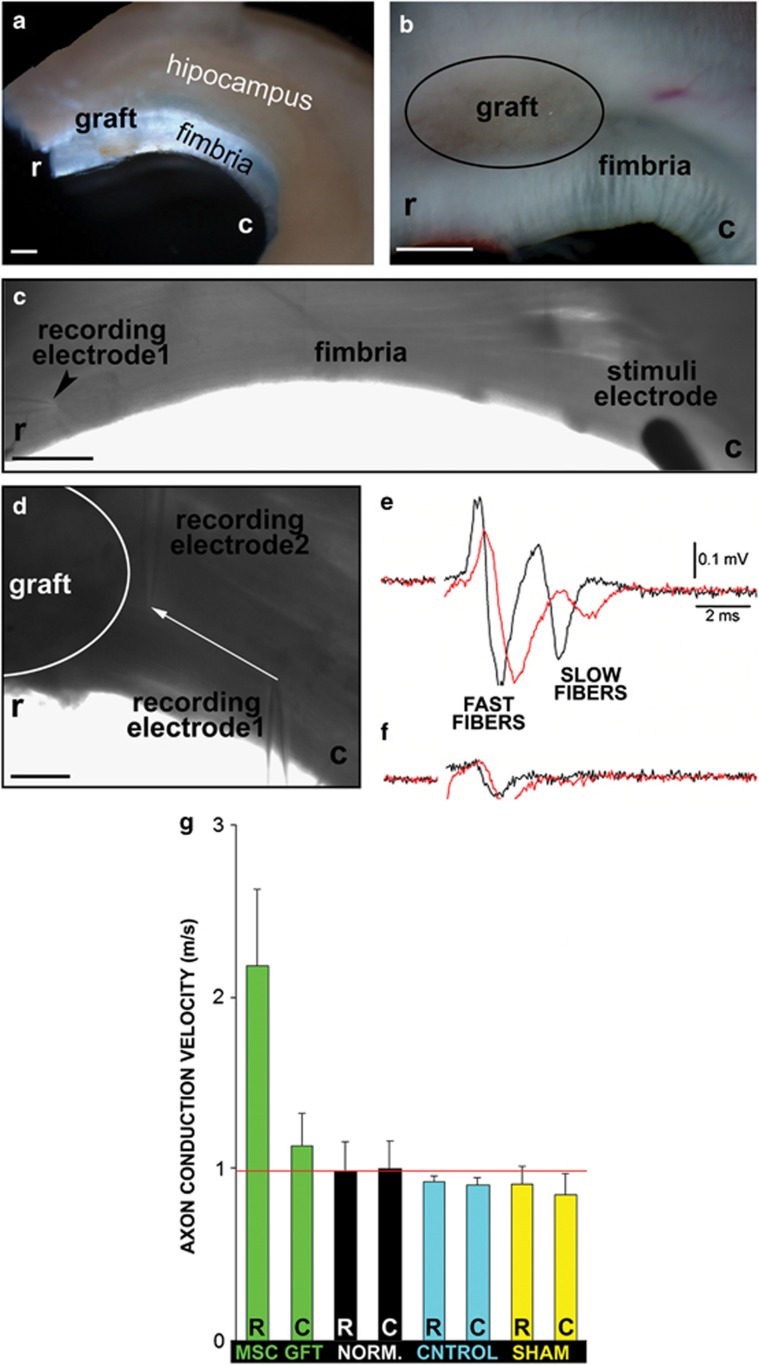
Figure 3.
Axon conduction velocity in various regions of the fimbria. (a and b) Images of the extracted fimbria, depicting the location of the graft. (c) The stimulus electrode located in the caudal region (c) of the fimbria and a registry electrode in the rostral area (caudal to the graft) (r). (d) Details of the position of the two registry electrodes to obtain the recordings of the caudal fibers around the graft (white line). (e and f) Two fibers were detected: fast (thicker myelin sheaths) and slow (thin and/or non-myelin sheaths) fibers. (g) Histogram depicting the axon potential velocities in the fast fibers measured in the MSC (green), normal non-demyelinated (black), sham-operated (yellow) and control demyelinated fimbria (blue) in the rostral (R) or caudal (C) regions. Red line denotes wild-type values. Scale bar, 1 mm (a and b); 500 μm (c); and 100 μm (d)

