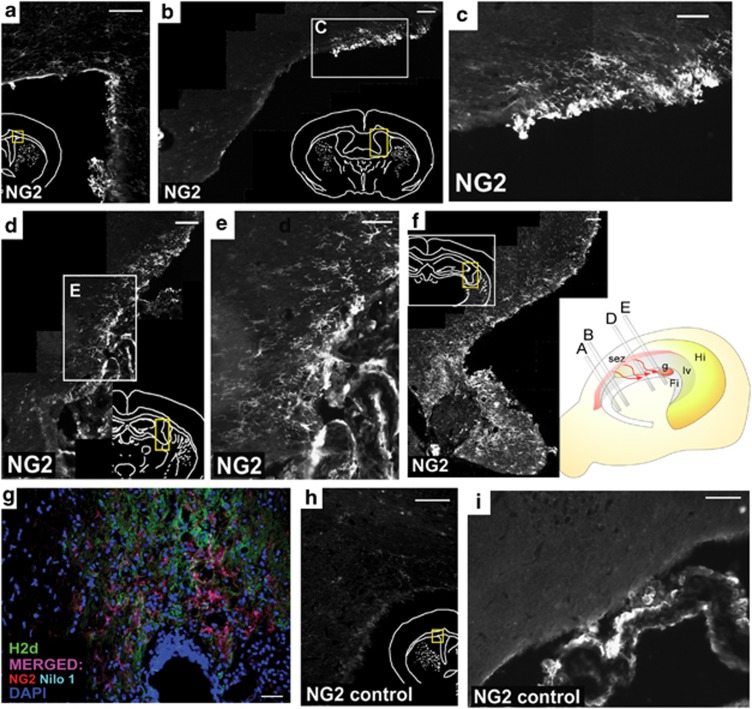
Figure 5.
Analysis of the neurogenic niches: subventricular zone. (a–f) Coronary sections of the LV showing NG2+ cells migrating from the subventricular zone to the MSC-grafted fimbria. NG2+ cells, corresponding to OPCs, migrate rostro-caudally from the subventricular zone in the side of the fimbria where the stem cells were injected (a). The cells migrated bordering the lateral ventricular until they reached the fimbria (b–f). (b) Immunohistochemical image depicting the NG2+ cells bordering the LV. (c) Close-up of inset in b, where the cells can be seen with a migratory morphology. (d) NG2+ cells entering the fimbria. (e) Close-up of the inset in d. (f) NG2+ cells surrounding the stem cell graft. The scheme to the right shows the spatial distribution of the images observed in a–f. g, graft; Fi; fimbria; lv, lateral ventricle; Hi, hippocampus. (g) Immunohistochemical analysis of the migrating NG2+/Nilo1+ cells. In the image, H2d is in green (Alexa Fluor 488), NG2 in red (Texas Red), Nilo1 is light blue (aminomethyl coumarin acetate) and 4′,6-diamidino-2-phenylindole in dark blue. Double-positive NG2 and Nilo1 cells are detected in purple. (h–i) The contralateral side of the fimbria, where no cells were injected, did not present the migrating cells observed in the treated side. Scale bar, 100 μm (c and h); 75 μm (e); 50 μm (a, b, d, f and i); and 25 μm (g)

