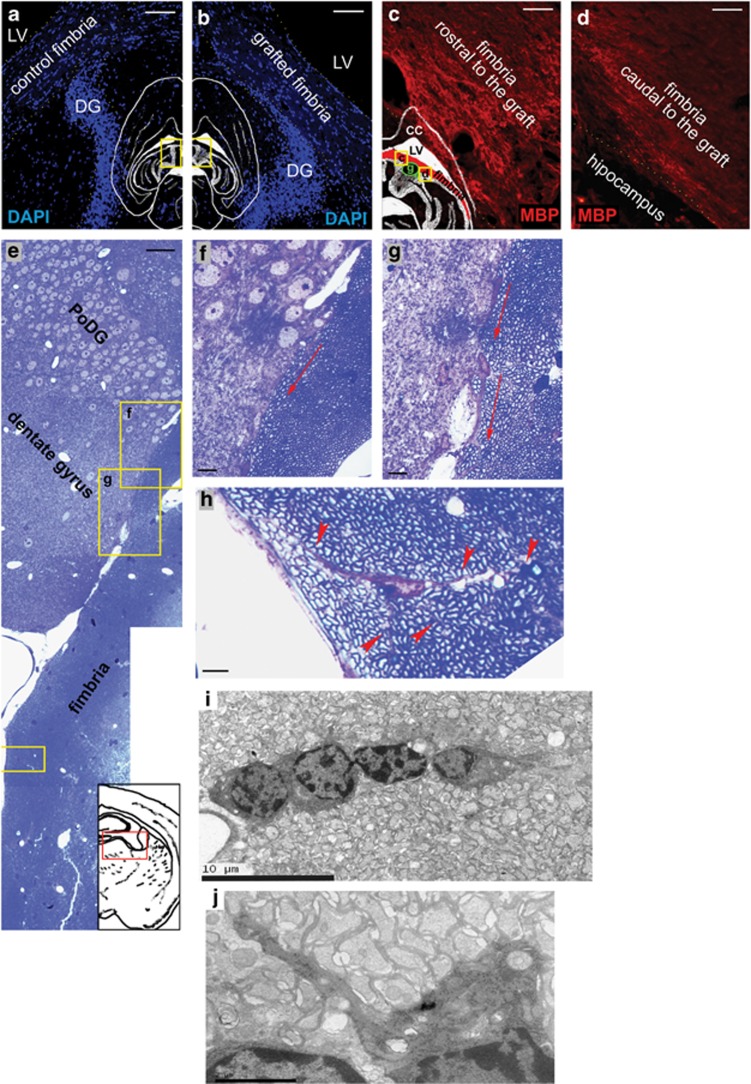
Figure 6.
Analysis of neurogenic niches: DG. (a and b) Horizontal sections of the contralateral (non-treated) and MSC-grafted side of the fimbria, respectively, showing the tight location of the DG and fimbria, delimited by yellow-dotted lines. Blue is 4′,6-diamidino-2-phenylindole staining. (c and d) MBP staining, in red, of the rostral (c) (see ‘r' yellow line in the localization scheme) and caudal (d) regions (see ‘c' yellow line in the localization scheme) to the graft (see ‘g' green line in the localization scheme), showing that the area closest to the DG expresses more MBP. (e) Reconstructed semi-thin ultramicrotome sagittal section showing cells migrating from the DG to the fimbria. (f–h) High magnifications of insets in e. Red arrows in f and g indicate cell polarity according to a possible cell migration from the DG. Red arrowheads in h indicates cytoplasmic prolongations from a oligodendrocyte ensheathing various axons. (i and j) Oligodendrocyte precursors migrating toward the graft, as observed by electron microscopy. Scale bar, 100 μm (a and b); 50 μm (c–e); 10 μm (f and g); and 5 μm (h)

