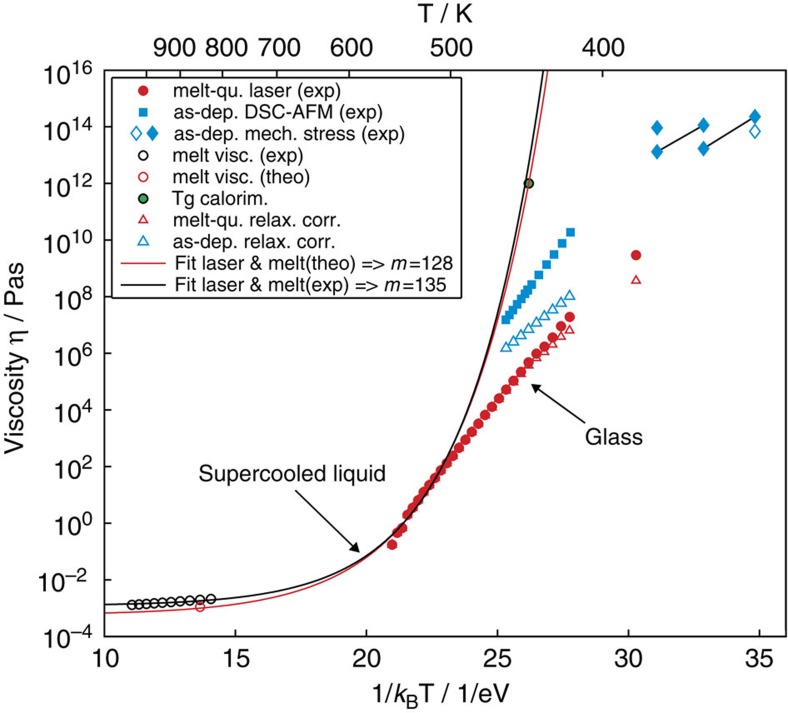
Figure 4. Temperature dependence of viscosity.
Reversing equation (1) and using the growth velocity measurements of Fig. 3, we have calculated the viscosity of AgInSbTe as a function of temperature (filled red circles). The general understanding that a glass is formed upon cooling from a supercooled liquid implies that the curves of supercooled liquid (continuous lines) and glass (red triangles) have to connect. The lines (black and red) are obtained by fitting the equation proposed by Mauro et al.38 for the description of the viscosity of a supercooled liquid to the laser results at the 11 highest measured temperatures, together with literature values for the viscosity in the liquid phase (in case of the black line the experimentally determined viscosities in liquid Sb80Te20, an alloy close to the base stoichiometry of the AgIn-doped SbTe used in the present work, from ref. 26 represented by the open black circles and in case of the red line the theoretically derived viscosity of AgInSbTe from ref. 27 represented by the red open circle). Both fits correspond well with a viscosity of 1012 Pas at the glass transition temperature Tg=443 K (green-filled circle) that was previously observed for AgInSbTe using calorimetry39. The blue squares are obtained using the data on as-deposited AgInSbTe reported in ref. 7. The blue diamonds are extracted from ref. 32 in which viscosity of AgInSbTe has been measured via stress relaxation. The filled blue diamonds represent the viscosity of annealed amorphous samples, the open diamond states the original value before annealing. The original viscosity values derived from growth velocities (red filled circles from current laser experiments and blue filled squares from previous studies on as-deposited amorphous AgInSbTe) are corrected for structural relaxation they had time for during the experiments resulting in open red and open blue triangles, respectively.

