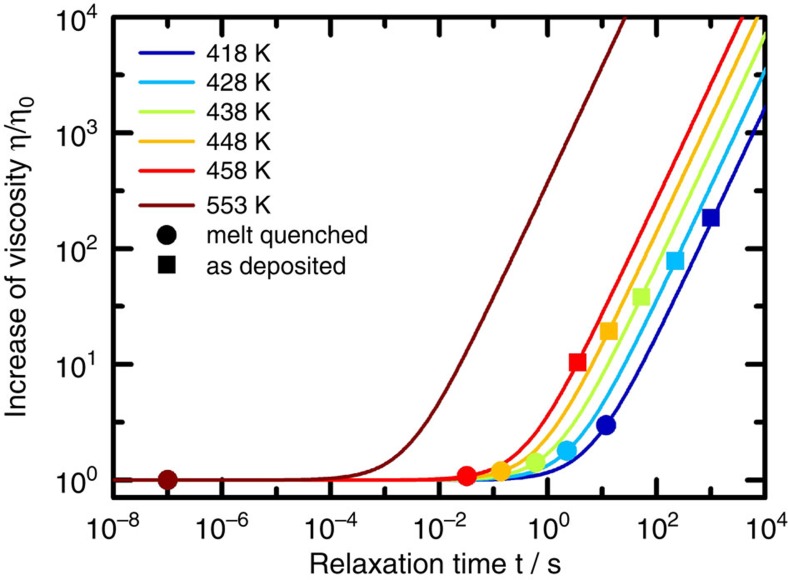
Figure 5. Temporal increase of viscosity due to structural relaxation.
The lines show the time evolution of viscosity at different temperatures (different colours) according to equation (3), in which the parameters have been chosen to reproduce the data reported in ref. 32. The filled circles indicate half of the recrystallization time of melt-quenched amorphous bits, whereas the squares refer to the incubation time before nucleation in as-deposited blanket films8, both at the respective experimentally realised temperature (indicated by the colour).

