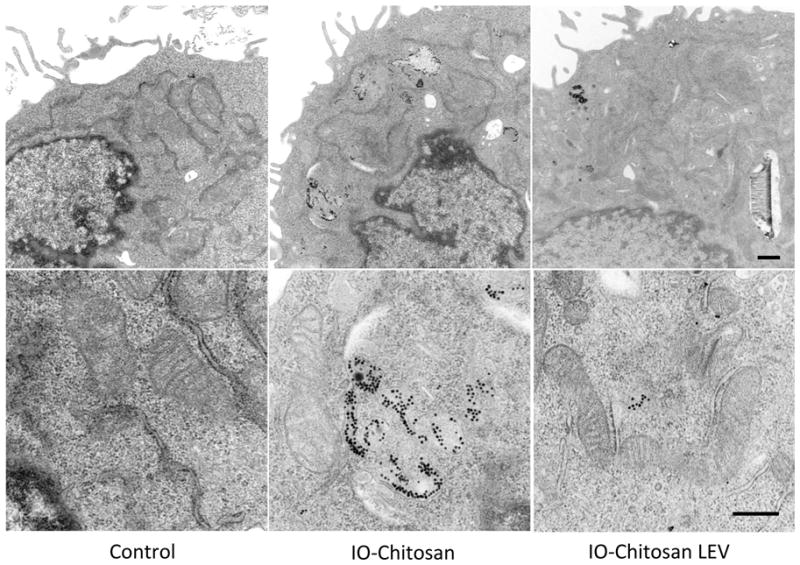
Figure 5.

TEM images of cells treated for 24 hours. Freely administered IO-chitosan appears in multi-vesicular bodies, whereas protected IO-chitosan freely associates with mitochondria. An ultra-structural analysis reveals no associated cell toxicity. Indicators of healthy cell function include the presence of an intact cell membrane and the absence of nuclear condensation, membrane blebbing, and vacuoles. Scale bars are 500nm.
