
Figure 8.
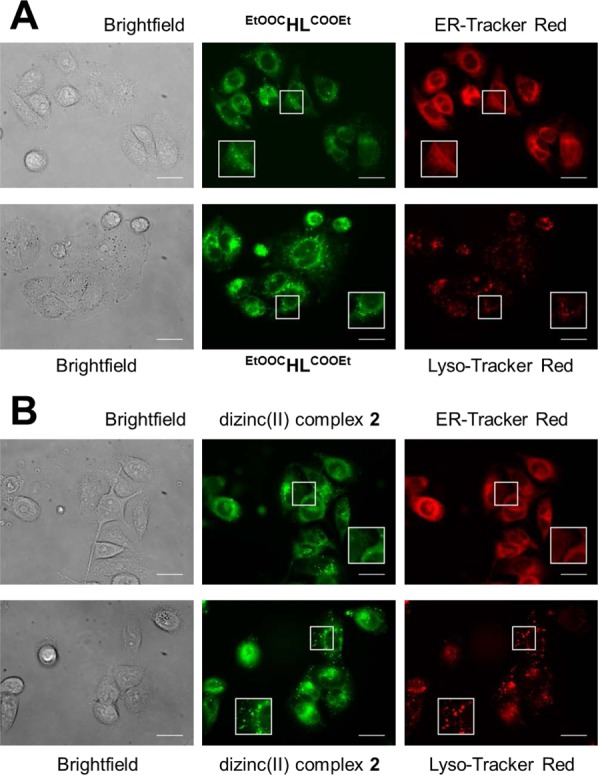
Fluorescence microscopy images of live SW480 cells. Cells were costained with 10 μM of EtOOCHLCOOEt (A) or 5 μM of 2 (B) and ER-Tracker Red (500 nM) and Lyso-Tracker Red (1 μM), respectively. Magnification of areas marked by squares are shown as insets. Scale bars are 20 μm.