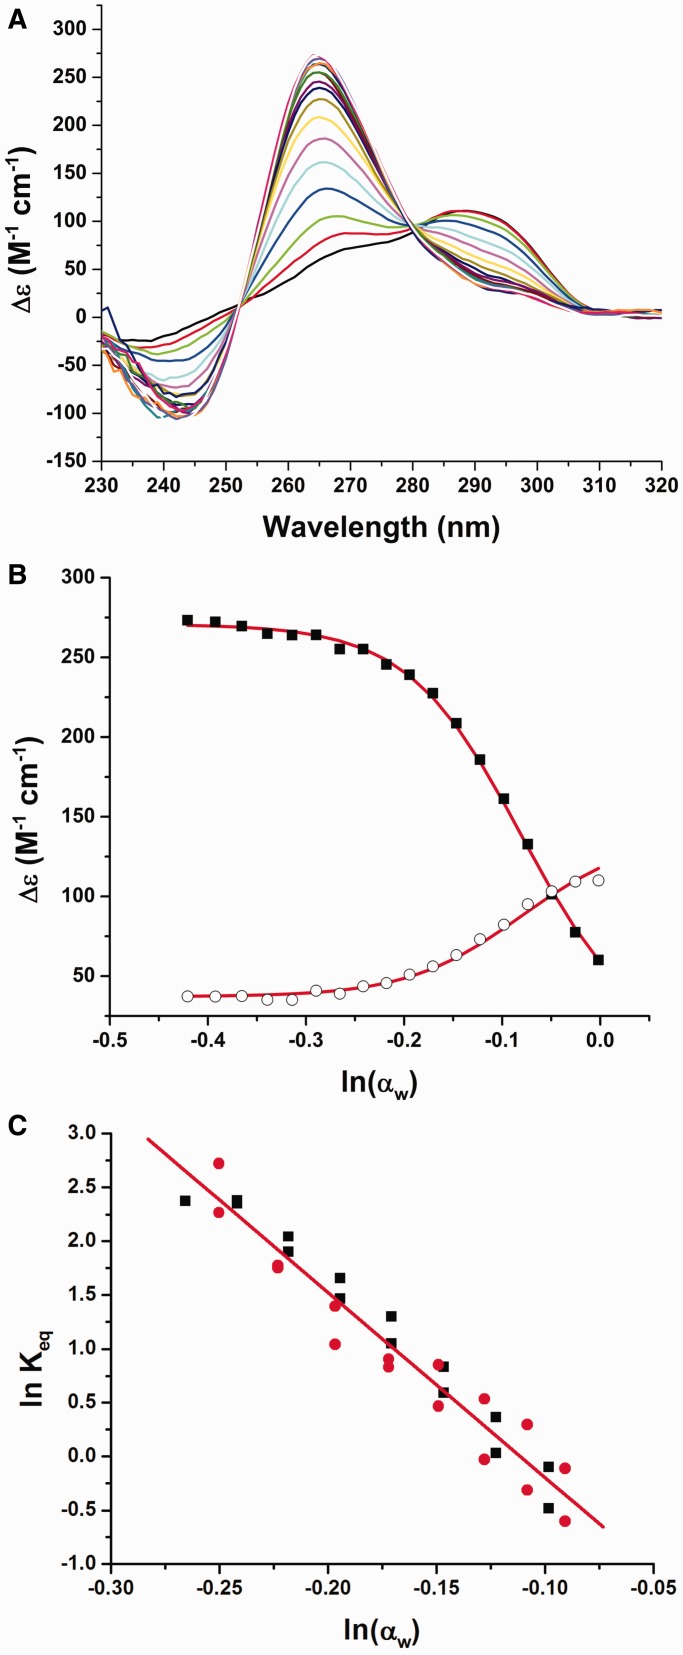
Figure 1.
Conformational change of hTel22 driven by decreased water activity in the presence of potassium at 20°C. (A) CD spectra obtained as a function of acetonitrile concentration. Addition of acetonitrile causes a shift in the CD spectrum from a major peak at 290 nm to a major peak at 265 nm. (B) The conformational change of the quadruplex monitored at 290 nm (circles) and 265 nm (solid squares) as a function of the natural logarithm of the water activity. The 295 nm signal monitors the loss of initial hybrid structure while the 265 nm signal arises from the appearance of parallel quadruplex. (C) Data for acetonitrile (black) and EG (red) plotted according to Equation (5) for determination of Keq,0 and Δnw. Global best-fit line (shown in red) for acetonitrile and EG was determined to be ln(Keq) = −1.91 − 17.2ln(αw).

